Immigrants from Morocco vs Immigrants from El Salvador Child Poverty Among Girls Under 16
COMPARE
Immigrants from Morocco
Immigrants from El Salvador
Child Poverty Among Girls Under 16
Child Poverty Among Girls Under 16 Comparison
Immigrants from Morocco
Immigrants from El Salvador
16.8%
CHILD POVERTY AMONG GIRLS UNDER 16
34.6/ 100
METRIC RATING
187th/ 347
METRIC RANK
20.0%
CHILD POVERTY AMONG GIRLS UNDER 16
0.1/ 100
METRIC RATING
272nd/ 347
METRIC RANK
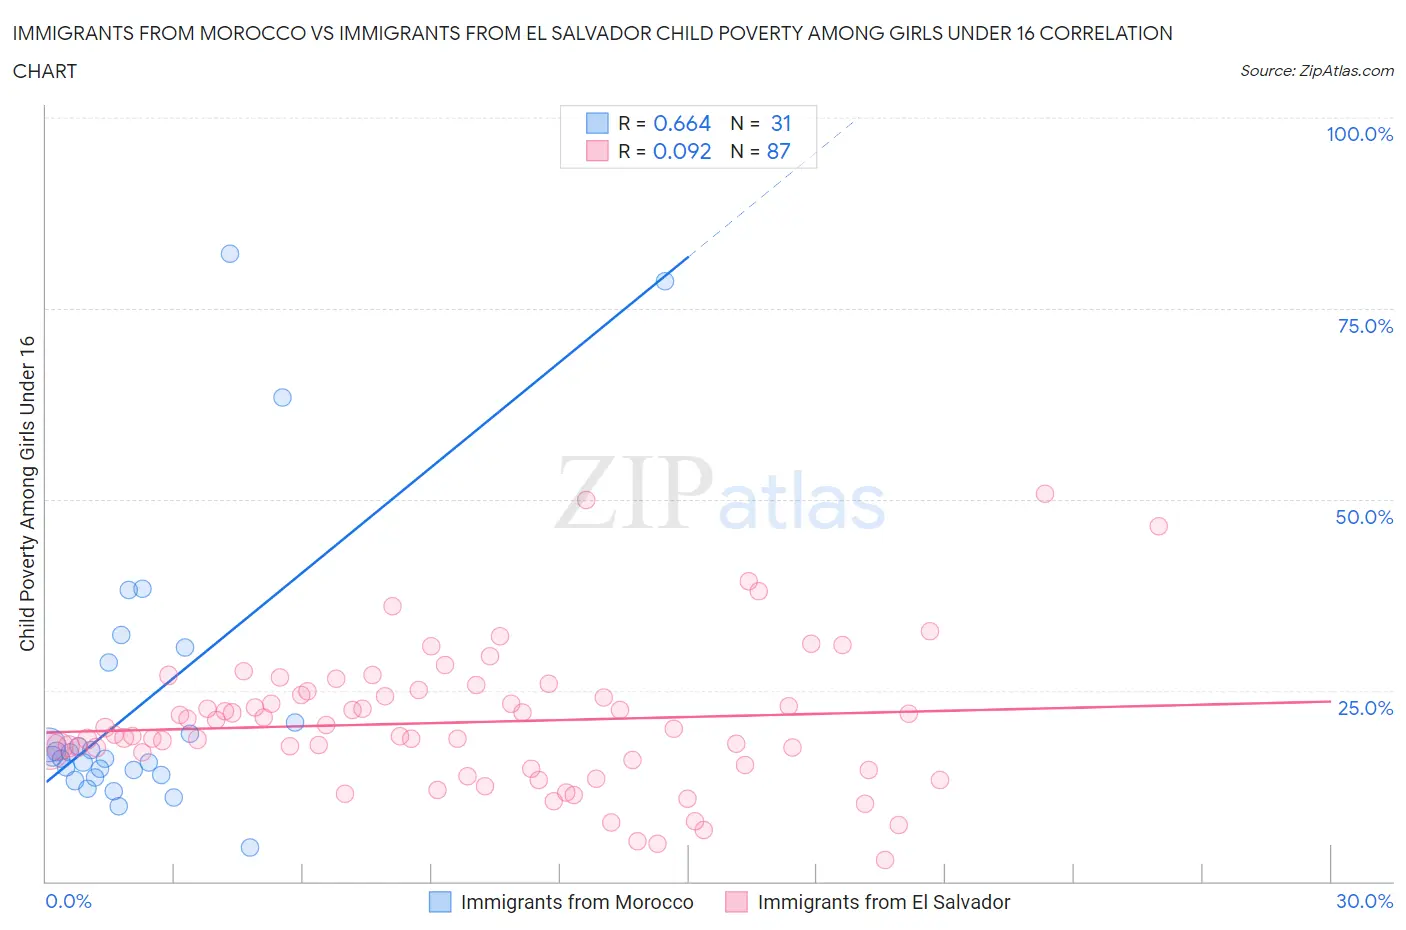
Immigrants from Morocco vs Immigrants from El Salvador Child Poverty Among Girls Under 16 Correlation Chart
The statistical analysis conducted on geographies consisting of 177,633,754 people shows a significant positive correlation between the proportion of Immigrants from Morocco and poverty level among girls under the age of 16 in the United States with a correlation coefficient (R) of 0.664 and weighted average of 16.8%. Similarly, the statistical analysis conducted on geographies consisting of 353,816,537 people shows a slight positive correlation between the proportion of Immigrants from El Salvador and poverty level among girls under the age of 16 in the United States with a correlation coefficient (R) of 0.092 and weighted average of 20.0%, a difference of 19.0%.
Child Poverty Among Girls Under 16 Correlation Summary
| Measurement | Immigrants from Morocco | Immigrants from El Salvador |
| Minimum | 4.5% | 2.8% |
| Maximum | 82.2% | 50.7% |
| Range | 77.7% | 47.8% |
| Mean | 23.6% | 20.8% |
| Median | 16.3% | 20.0% |
| Interquartile 25% (IQ1) | 14.0% | 15.2% |
| Interquartile 75% (IQ3) | 28.7% | 24.9% |
| Interquartile Range (IQR) | 14.7% | 9.8% |
| Standard Deviation (Sample) | 18.9% | 9.1% |
| Standard Deviation (Population) | 18.5% | 9.0% |
Similar Demographics by Child Poverty Among Girls Under 16
Demographics Similar to Immigrants from Morocco by Child Poverty Among Girls Under 16
In terms of child poverty among girls under 16, the demographic groups most similar to Immigrants from Morocco are Arab (16.8%, a difference of 0.010%), South American Indian (16.8%, a difference of 0.050%), Immigrants from Uruguay (16.7%, a difference of 0.13%), Immigrants from Bosnia and Herzegovina (16.8%, a difference of 0.26%), and Kenyan (16.8%, a difference of 0.29%).
| Demographics | Rating | Rank | Child Poverty Among Girls Under 16 |
| Immigrants | Syria | 43.3 /100 | #180 | Average 16.6% |
| Immigrants | Iraq | 43.2 /100 | #181 | Average 16.6% |
| Immigrants | Ethiopia | 43.1 /100 | #182 | Average 16.6% |
| Immigrants | Portugal | 42.5 /100 | #183 | Average 16.6% |
| Scotch-Irish | 39.6 /100 | #184 | Fair 16.7% |
| Immigrants | Uruguay | 35.6 /100 | #185 | Fair 16.7% |
| South American Indians | 35.0 /100 | #186 | Fair 16.8% |
| Immigrants | Morocco | 34.6 /100 | #187 | Fair 16.8% |
| Arabs | 34.5 /100 | #188 | Fair 16.8% |
| Immigrants | Bosnia and Herzegovina | 32.5 /100 | #189 | Fair 16.8% |
| Kenyans | 32.3 /100 | #190 | Fair 16.8% |
| Immigrants | Azores | 31.3 /100 | #191 | Fair 16.8% |
| Immigrants | Uganda | 31.3 /100 | #192 | Fair 16.8% |
| Aleuts | 28.7 /100 | #193 | Fair 16.9% |
| Spanish | 28.6 /100 | #194 | Fair 16.9% |
Demographics Similar to Immigrants from El Salvador by Child Poverty Among Girls Under 16
In terms of child poverty among girls under 16, the demographic groups most similar to Immigrants from El Salvador are Immigrants from Barbados (19.9%, a difference of 0.11%), Bangladeshi (20.0%, a difference of 0.20%), Cherokee (19.9%, a difference of 0.21%), Liberian (19.9%, a difference of 0.40%), and Spanish American Indian (19.9%, a difference of 0.50%).
| Demographics | Rating | Rank | Child Poverty Among Girls Under 16 |
| Immigrants | Jamaica | 0.1 /100 | #265 | Tragic 19.8% |
| Spanish Americans | 0.1 /100 | #266 | Tragic 19.8% |
| Immigrants | Bangladesh | 0.1 /100 | #267 | Tragic 19.9% |
| Spanish American Indians | 0.1 /100 | #268 | Tragic 19.9% |
| Liberians | 0.1 /100 | #269 | Tragic 19.9% |
| Cherokee | 0.1 /100 | #270 | Tragic 19.9% |
| Immigrants | Barbados | 0.1 /100 | #271 | Tragic 19.9% |
| Immigrants | El Salvador | 0.1 /100 | #272 | Tragic 20.0% |
| Bangladeshis | 0.1 /100 | #273 | Tragic 20.0% |
| Immigrants | St. Vincent and the Grenadines | 0.0 /100 | #274 | Tragic 20.1% |
| Sub-Saharan Africans | 0.0 /100 | #275 | Tragic 20.1% |
| Comanche | 0.0 /100 | #276 | Tragic 20.2% |
| Belizeans | 0.0 /100 | #277 | Tragic 20.2% |
| Barbadians | 0.0 /100 | #278 | Tragic 20.2% |
| Immigrants | Zaire | 0.0 /100 | #279 | Tragic 20.2% |