Immigrants from Moldova vs Japanese Single Father Poverty
COMPARE
Immigrants from Moldova
Japanese
Single Father Poverty
Single Father Poverty Comparison
Immigrants from Moldova
Japanese
15.2%
SINGLE FATHER POVERTY
99.8/ 100
METRIC RATING
66th/ 347
METRIC RANK
15.2%
SINGLE FATHER POVERTY
99.7/ 100
METRIC RATING
69th/ 347
METRIC RANK
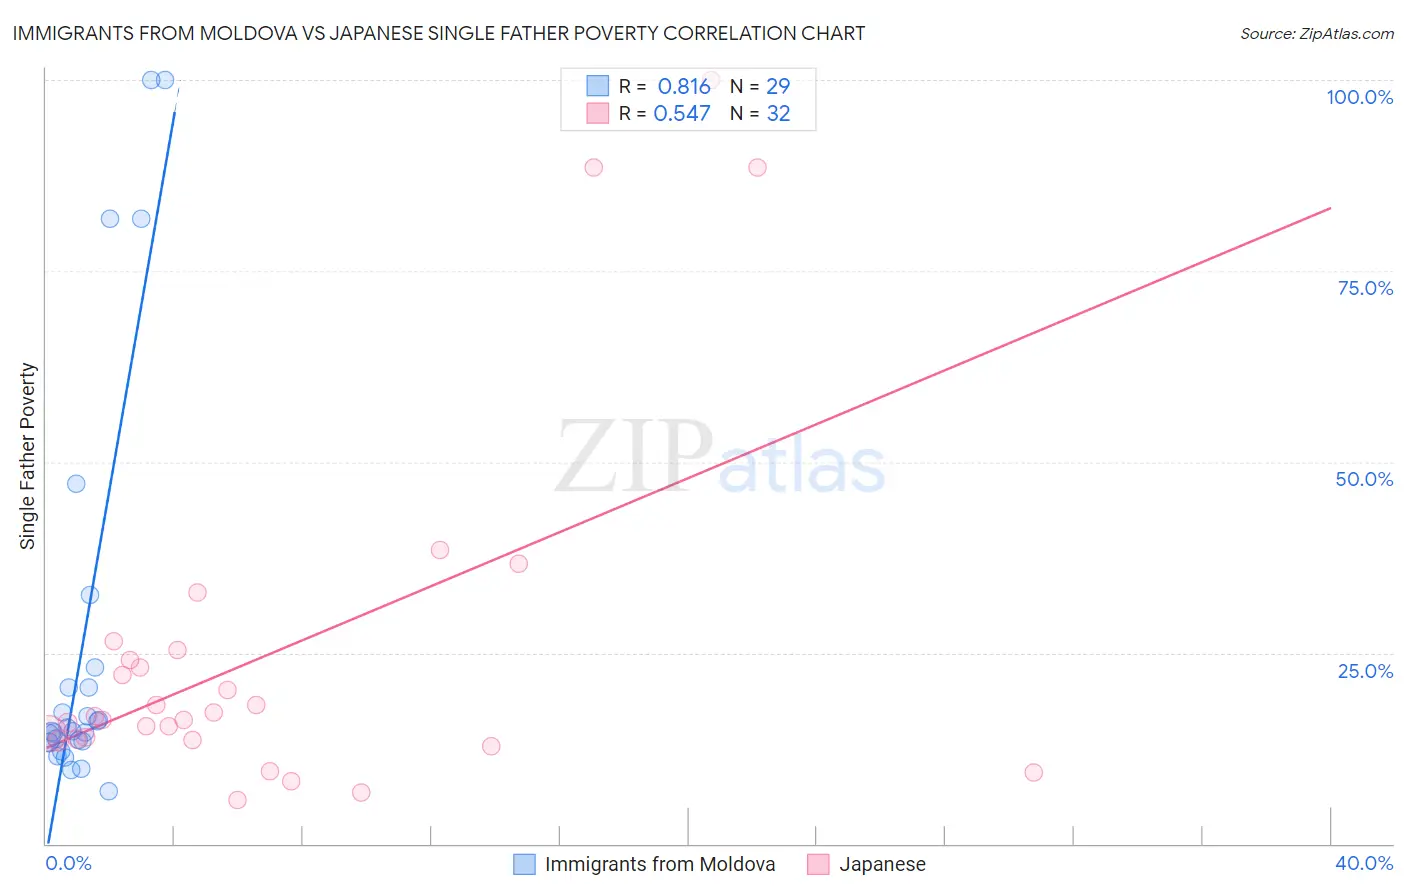
Immigrants from Moldova vs Japanese Single Father Poverty Correlation Chart
The statistical analysis conducted on geographies consisting of 107,585,694 people shows a very strong positive correlation between the proportion of Immigrants from Moldova and poverty level among single fathers in the United States with a correlation coefficient (R) of 0.816 and weighted average of 15.2%. Similarly, the statistical analysis conducted on geographies consisting of 212,212,459 people shows a substantial positive correlation between the proportion of Japanese and poverty level among single fathers in the United States with a correlation coefficient (R) of 0.547 and weighted average of 15.2%, a difference of 0.20%.
Single Father Poverty Correlation Summary
| Measurement | Immigrants from Moldova | Japanese |
| Minimum | 6.9% | 5.7% |
| Maximum | 100.0% | 100.0% |
| Range | 93.1% | 94.3% |
| Mean | 26.8% | 24.9% |
| Median | 14.7% | 16.5% |
| Interquartile 25% (IQ1) | 13.3% | 13.6% |
| Interquartile 75% (IQ3) | 21.8% | 24.7% |
| Interquartile Range (IQR) | 8.4% | 11.1% |
| Standard Deviation (Sample) | 27.4% | 23.4% |
| Standard Deviation (Population) | 26.9% | 23.1% |
Demographics Similar to Immigrants from Moldova and Japanese by Single Father Poverty
In terms of single father poverty, the demographic groups most similar to Immigrants from Moldova are Immigrants from Malaysia (15.2%, a difference of 0.020%), Paraguayan (15.2%, a difference of 0.090%), Bangladeshi (15.2%, a difference of 0.11%), Immigrants from Cameroon (15.2%, a difference of 0.18%), and Immigrants from Sweden (15.2%, a difference of 0.19%). Similarly, the demographic groups most similar to Japanese are Immigrants from Cameroon (15.2%, a difference of 0.030%), Mongolian (15.3%, a difference of 0.10%), Paraguayan (15.2%, a difference of 0.11%), Immigrants from Malaysia (15.2%, a difference of 0.23%), and Bangladeshi (15.2%, a difference of 0.31%).
| Demographics | Rating | Rank | Single Father Poverty |
| Laotians | 99.9 /100 | #57 | Exceptional 15.1% |
| Hawaiians | 99.9 /100 | #58 | Exceptional 15.1% |
| Guamanians/Chamorros | 99.9 /100 | #59 | Exceptional 15.1% |
| Puget Sound Salish | 99.8 /100 | #60 | Exceptional 15.2% |
| Immigrants | Bosnia and Herzegovina | 99.8 /100 | #61 | Exceptional 15.2% |
| Immigrants | Armenia | 99.8 /100 | #62 | Exceptional 15.2% |
| Immigrants | Sweden | 99.8 /100 | #63 | Exceptional 15.2% |
| Bangladeshis | 99.8 /100 | #64 | Exceptional 15.2% |
| Immigrants | Malaysia | 99.8 /100 | #65 | Exceptional 15.2% |
| Immigrants | Moldova | 99.8 /100 | #66 | Exceptional 15.2% |
| Paraguayans | 99.7 /100 | #67 | Exceptional 15.2% |
| Immigrants | Cameroon | 99.7 /100 | #68 | Exceptional 15.2% |
| Japanese | 99.7 /100 | #69 | Exceptional 15.2% |
| Mongolians | 99.7 /100 | #70 | Exceptional 15.3% |
| Immigrants | Brazil | 99.6 /100 | #71 | Exceptional 15.3% |
| Immigrants | Lithuania | 99.6 /100 | #72 | Exceptional 15.3% |
| Kenyans | 99.6 /100 | #73 | Exceptional 15.3% |
| Maltese | 99.6 /100 | #74 | Exceptional 15.3% |
| Immigrants | Turkey | 99.5 /100 | #75 | Exceptional 15.3% |
| Immigrants | Japan | 99.5 /100 | #76 | Exceptional 15.3% |
| Immigrants | Peru | 99.5 /100 | #77 | Exceptional 15.3% |