Immigrants from Malaysia vs Haitian Child Poverty Among Boys Under 16
COMPARE
Immigrants from Malaysia
Haitian
Child Poverty Among Boys Under 16
Child Poverty Among Boys Under 16 Comparison
Immigrants from Malaysia
Haitians
15.3%
CHILD POVERTY AMONG BOYS UNDER 16
92.8/ 100
METRIC RATING
122nd/ 347
METRIC RANK
21.0%
CHILD POVERTY AMONG BOYS UNDER 16
0.0/ 100
METRIC RATING
300th/ 347
METRIC RANK
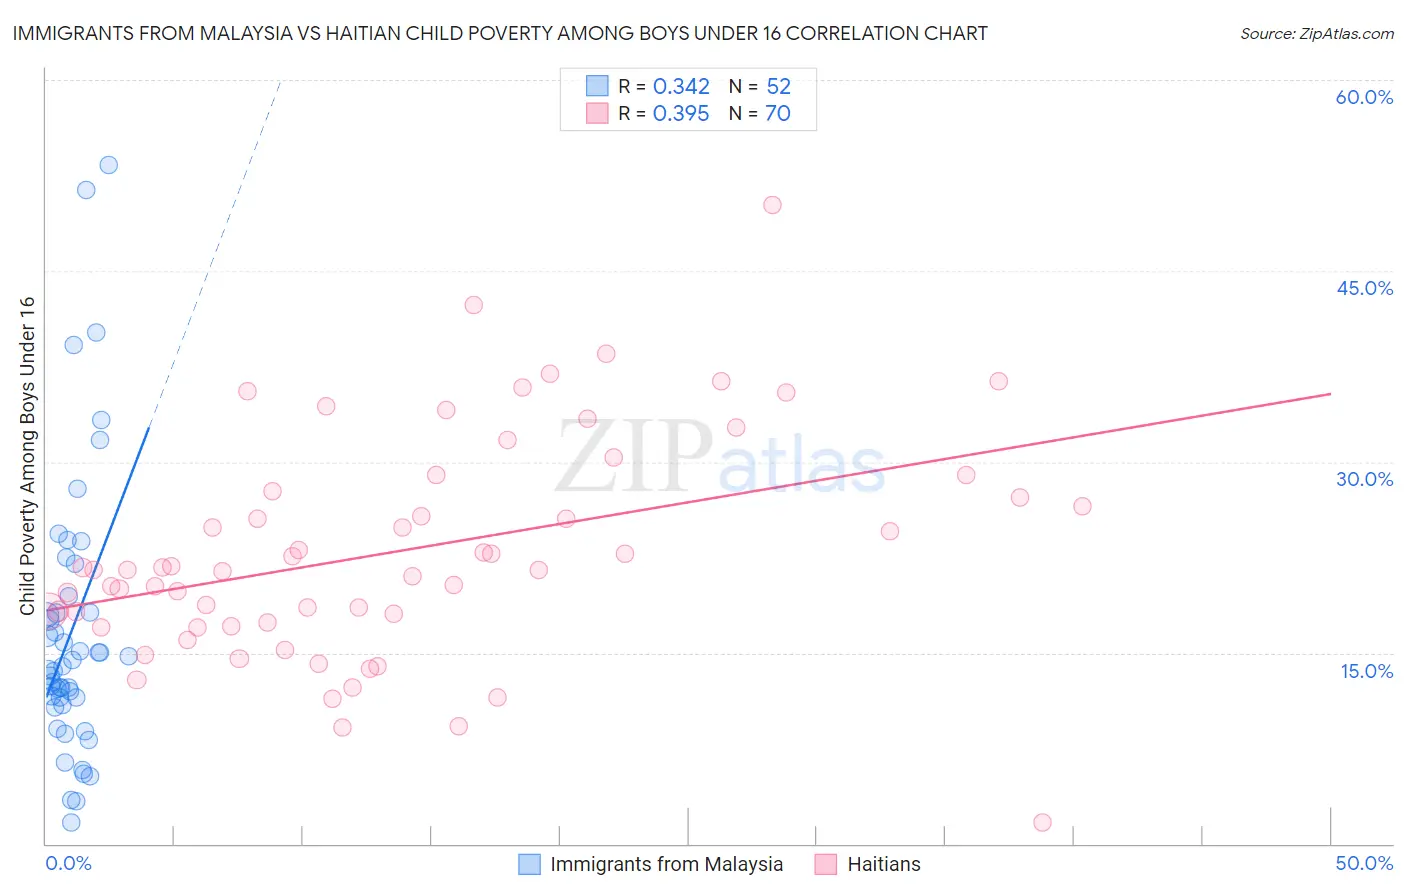
Immigrants from Malaysia vs Haitian Child Poverty Among Boys Under 16 Correlation Chart
The statistical analysis conducted on geographies consisting of 196,365,608 people shows a mild positive correlation between the proportion of Immigrants from Malaysia and poverty level among boys under the age of 16 in the United States with a correlation coefficient (R) of 0.342 and weighted average of 15.3%. Similarly, the statistical analysis conducted on geographies consisting of 284,969,513 people shows a mild positive correlation between the proportion of Haitians and poverty level among boys under the age of 16 in the United States with a correlation coefficient (R) of 0.395 and weighted average of 21.0%, a difference of 37.8%.
Child Poverty Among Boys Under 16 Correlation Summary
| Measurement | Immigrants from Malaysia | Haitian |
| Minimum | 1.7% | 1.7% |
| Maximum | 53.3% | 50.2% |
| Range | 51.6% | 48.5% |
| Mean | 16.7% | 23.0% |
| Median | 13.8% | 21.5% |
| Interquartile 25% (IQ1) | 11.2% | 17.4% |
| Interquartile 75% (IQ3) | 18.8% | 27.7% |
| Interquartile Range (IQR) | 7.6% | 10.3% |
| Standard Deviation (Sample) | 11.0% | 8.8% |
| Standard Deviation (Population) | 10.8% | 8.7% |
Similar Demographics by Child Poverty Among Boys Under 16
Demographics Similar to Immigrants from Malaysia by Child Poverty Among Boys Under 16
In terms of child poverty among boys under 16, the demographic groups most similar to Immigrants from Malaysia are Scottish (15.2%, a difference of 0.10%), South African (15.2%, a difference of 0.11%), Belgian (15.2%, a difference of 0.16%), Immigrants from Norway (15.3%, a difference of 0.22%), and Tlingit-Haida (15.3%, a difference of 0.23%).
| Demographics | Rating | Rank | Child Poverty Among Boys Under 16 |
| Armenians | 93.6 /100 | #115 | Exceptional 15.2% |
| Immigrants | South Eastern Asia | 93.5 /100 | #116 | Exceptional 15.2% |
| Immigrants | Vietnam | 93.5 /100 | #117 | Exceptional 15.2% |
| Native Hawaiians | 93.4 /100 | #118 | Exceptional 15.2% |
| Belgians | 93.1 /100 | #119 | Exceptional 15.2% |
| South Africans | 93.0 /100 | #120 | Exceptional 15.2% |
| Scottish | 93.0 /100 | #121 | Exceptional 15.2% |
| Immigrants | Malaysia | 92.8 /100 | #122 | Exceptional 15.3% |
| Immigrants | Norway | 92.3 /100 | #123 | Exceptional 15.3% |
| Tlingit-Haida | 92.2 /100 | #124 | Exceptional 15.3% |
| Czechoslovakians | 92.1 /100 | #125 | Exceptional 15.3% |
| Palestinians | 91.3 /100 | #126 | Exceptional 15.4% |
| Carpatho Rusyns | 91.1 /100 | #127 | Exceptional 15.4% |
| Canadians | 90.6 /100 | #128 | Exceptional 15.4% |
| Immigrants | Brazil | 90.3 /100 | #129 | Exceptional 15.4% |
Demographics Similar to Haitians by Child Poverty Among Boys Under 16
In terms of child poverty among boys under 16, the demographic groups most similar to Haitians are Immigrants from Caribbean (21.0%, a difference of 0.050%), Chippewa (21.0%, a difference of 0.32%), Guatemalan (21.1%, a difference of 0.54%), Somali (21.1%, a difference of 0.54%), and Hispanic or Latino (20.9%, a difference of 0.58%).
| Demographics | Rating | Rank | Child Poverty Among Boys Under 16 |
| Immigrants | Senegal | 0.0 /100 | #293 | Tragic 20.7% |
| Immigrants | Bahamas | 0.0 /100 | #294 | Tragic 20.7% |
| Mexicans | 0.0 /100 | #295 | Tragic 20.7% |
| Indonesians | 0.0 /100 | #296 | Tragic 20.8% |
| Hispanics or Latinos | 0.0 /100 | #297 | Tragic 20.9% |
| Chippewa | 0.0 /100 | #298 | Tragic 21.0% |
| Immigrants | Caribbean | 0.0 /100 | #299 | Tragic 21.0% |
| Haitians | 0.0 /100 | #300 | Tragic 21.0% |
| Guatemalans | 0.0 /100 | #301 | Tragic 21.1% |
| Somalis | 0.0 /100 | #302 | Tragic 21.1% |
| Immigrants | Haiti | 0.0 /100 | #303 | Tragic 21.3% |
| Immigrants | Central America | 0.0 /100 | #304 | Tragic 21.3% |
| Kiowa | 0.0 /100 | #305 | Tragic 21.3% |
| Immigrants | Grenada | 0.0 /100 | #306 | Tragic 21.3% |
| Choctaw | 0.0 /100 | #307 | Tragic 21.3% |