Immigrants from Lithuania vs Taiwanese Child Poverty Among Girls Under 16
COMPARE
Immigrants from Lithuania
Taiwanese
Child Poverty Among Girls Under 16
Child Poverty Among Girls Under 16 Comparison
Immigrants from Lithuania
Taiwanese
13.1%
CHILD POVERTY AMONG GIRLS UNDER 16
99.9/ 100
METRIC RATING
16th/ 347
METRIC RANK
14.6%
CHILD POVERTY AMONG GIRLS UNDER 16
98.0/ 100
METRIC RATING
74th/ 347
METRIC RANK
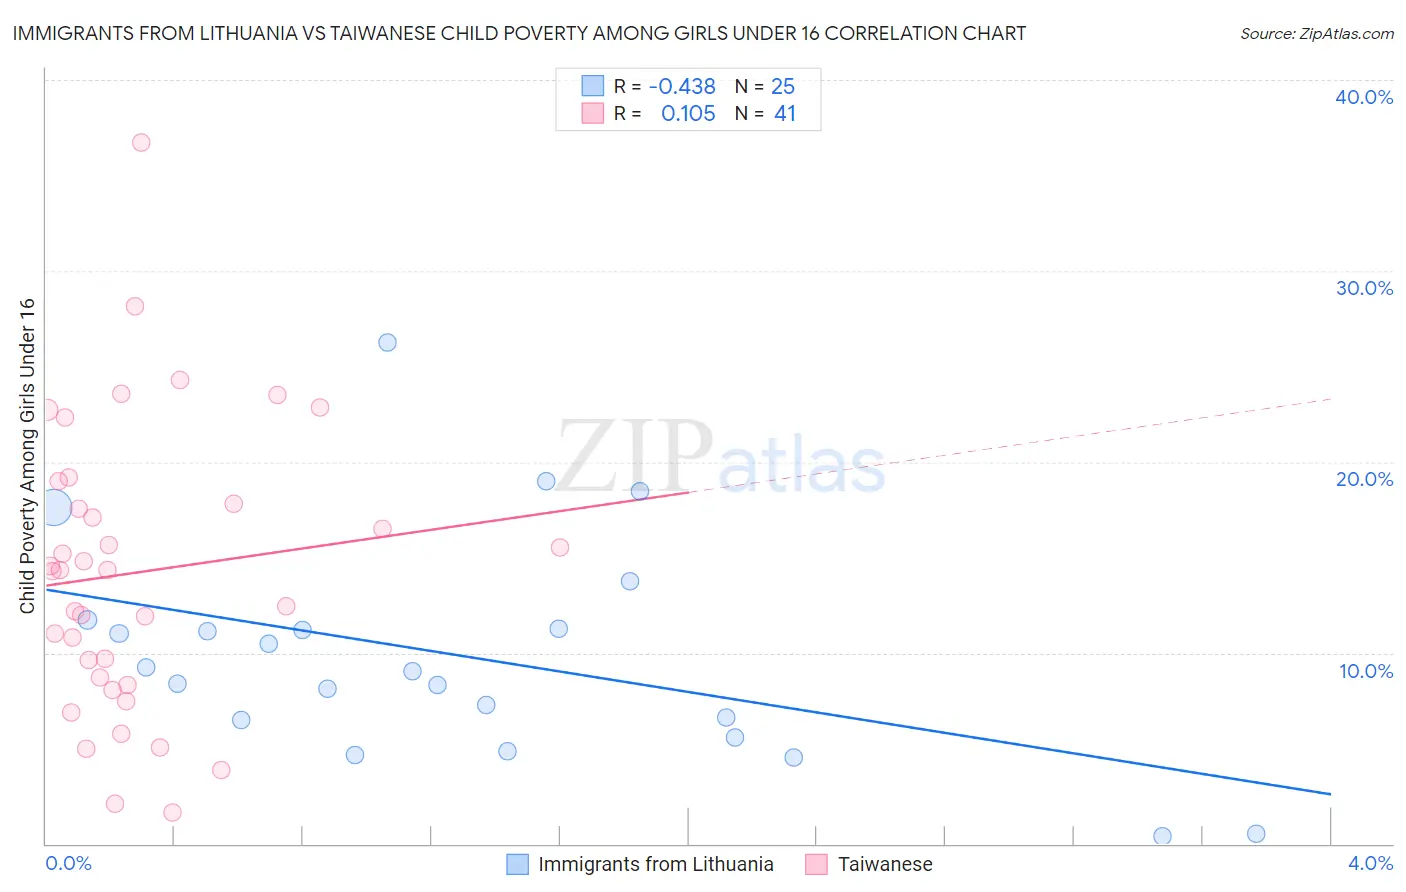
Immigrants from Lithuania vs Taiwanese Child Poverty Among Girls Under 16 Correlation Chart
The statistical analysis conducted on geographies consisting of 116,605,059 people shows a moderate negative correlation between the proportion of Immigrants from Lithuania and poverty level among girls under the age of 16 in the United States with a correlation coefficient (R) of -0.438 and weighted average of 13.1%. Similarly, the statistical analysis conducted on geographies consisting of 31,593,485 people shows a poor positive correlation between the proportion of Taiwanese and poverty level among girls under the age of 16 in the United States with a correlation coefficient (R) of 0.105 and weighted average of 14.6%, a difference of 11.3%.
Child Poverty Among Girls Under 16 Correlation Summary
| Measurement | Immigrants from Lithuania | Taiwanese |
| Minimum | 0.39% | 1.6% |
| Maximum | 26.3% | 36.8% |
| Range | 25.9% | 35.2% |
| Mean | 9.8% | 14.2% |
| Median | 9.0% | 14.4% |
| Interquartile 25% (IQ1) | 6.0% | 8.5% |
| Interquartile 75% (IQ3) | 11.5% | 18.4% |
| Interquartile Range (IQR) | 5.4% | 9.9% |
| Standard Deviation (Sample) | 5.9% | 7.4% |
| Standard Deviation (Population) | 5.7% | 7.4% |
Similar Demographics by Child Poverty Among Girls Under 16
Demographics Similar to Immigrants from Lithuania by Child Poverty Among Girls Under 16
In terms of child poverty among girls under 16, the demographic groups most similar to Immigrants from Lithuania are Bulgarian (13.1%, a difference of 0.080%), Immigrants from Korea (13.1%, a difference of 0.10%), Cypriot (13.2%, a difference of 0.47%), Okinawan (13.0%, a difference of 0.92%), and Burmese (13.0%, a difference of 0.93%).
| Demographics | Rating | Rank | Child Poverty Among Girls Under 16 |
| Immigrants | Singapore | 100.0 /100 | #9 | Exceptional 12.5% |
| Immigrants | Iran | 100.0 /100 | #10 | Exceptional 12.6% |
| Immigrants | South Central Asia | 100.0 /100 | #11 | Exceptional 12.7% |
| Bhutanese | 100.0 /100 | #12 | Exceptional 12.7% |
| Immigrants | Ireland | 99.9 /100 | #13 | Exceptional 12.9% |
| Burmese | 99.9 /100 | #14 | Exceptional 13.0% |
| Okinawans | 99.9 /100 | #15 | Exceptional 13.0% |
| Immigrants | Lithuania | 99.9 /100 | #16 | Exceptional 13.1% |
| Bulgarians | 99.9 /100 | #17 | Exceptional 13.1% |
| Immigrants | Korea | 99.9 /100 | #18 | Exceptional 13.1% |
| Cypriots | 99.9 /100 | #19 | Exceptional 13.2% |
| Immigrants | Japan | 99.9 /100 | #20 | Exceptional 13.3% |
| Assyrians/Chaldeans/Syriacs | 99.9 /100 | #21 | Exceptional 13.3% |
| Indians (Asian) | 99.9 /100 | #22 | Exceptional 13.3% |
| Norwegians | 99.9 /100 | #23 | Exceptional 13.3% |
Demographics Similar to Taiwanese by Child Poverty Among Girls Under 16
In terms of child poverty among girls under 16, the demographic groups most similar to Taiwanese are Immigrants from Austria (14.6%, a difference of 0.030%), Immigrants from Eastern Europe (14.6%, a difference of 0.070%), Immigrants from Netherlands (14.6%, a difference of 0.12%), Slovene (14.6%, a difference of 0.15%), and European (14.6%, a difference of 0.19%).
| Demographics | Rating | Rank | Child Poverty Among Girls Under 16 |
| Laotians | 98.4 /100 | #67 | Exceptional 14.5% |
| Immigrants | Argentina | 98.3 /100 | #68 | Exceptional 14.6% |
| Immigrants | Poland | 98.2 /100 | #69 | Exceptional 14.6% |
| Europeans | 98.1 /100 | #70 | Exceptional 14.6% |
| Slovenes | 98.1 /100 | #71 | Exceptional 14.6% |
| Immigrants | Netherlands | 98.1 /100 | #72 | Exceptional 14.6% |
| Immigrants | Austria | 98.0 /100 | #73 | Exceptional 14.6% |
| Taiwanese | 98.0 /100 | #74 | Exceptional 14.6% |
| Immigrants | Eastern Europe | 98.0 /100 | #75 | Exceptional 14.6% |
| Immigrants | Russia | 97.9 /100 | #76 | Exceptional 14.7% |
| Tlingit-Haida | 97.9 /100 | #77 | Exceptional 14.7% |
| Argentineans | 97.9 /100 | #78 | Exceptional 14.7% |
| Immigrants | Turkey | 97.9 /100 | #79 | Exceptional 14.7% |
| Egyptians | 97.9 /100 | #80 | Exceptional 14.7% |
| Ukrainians | 97.7 /100 | #81 | Exceptional 14.7% |