Immigrants from Lithuania vs Immigrants from Latin America Child Poverty Under the Age of 5
COMPARE
Immigrants from Lithuania
Immigrants from Latin America
Child Poverty Under the Age of 5
Child Poverty Under the Age of 5 Comparison
Immigrants from Lithuania
Immigrants from Latin America
14.1%
CHILD POVERTY UNDER THE AGE OF 5
99.9/ 100
METRIC RATING
26th/ 347
METRIC RANK
21.2%
CHILD POVERTY UNDER THE AGE OF 5
0.0/ 100
METRIC RATING
286th/ 347
METRIC RANK
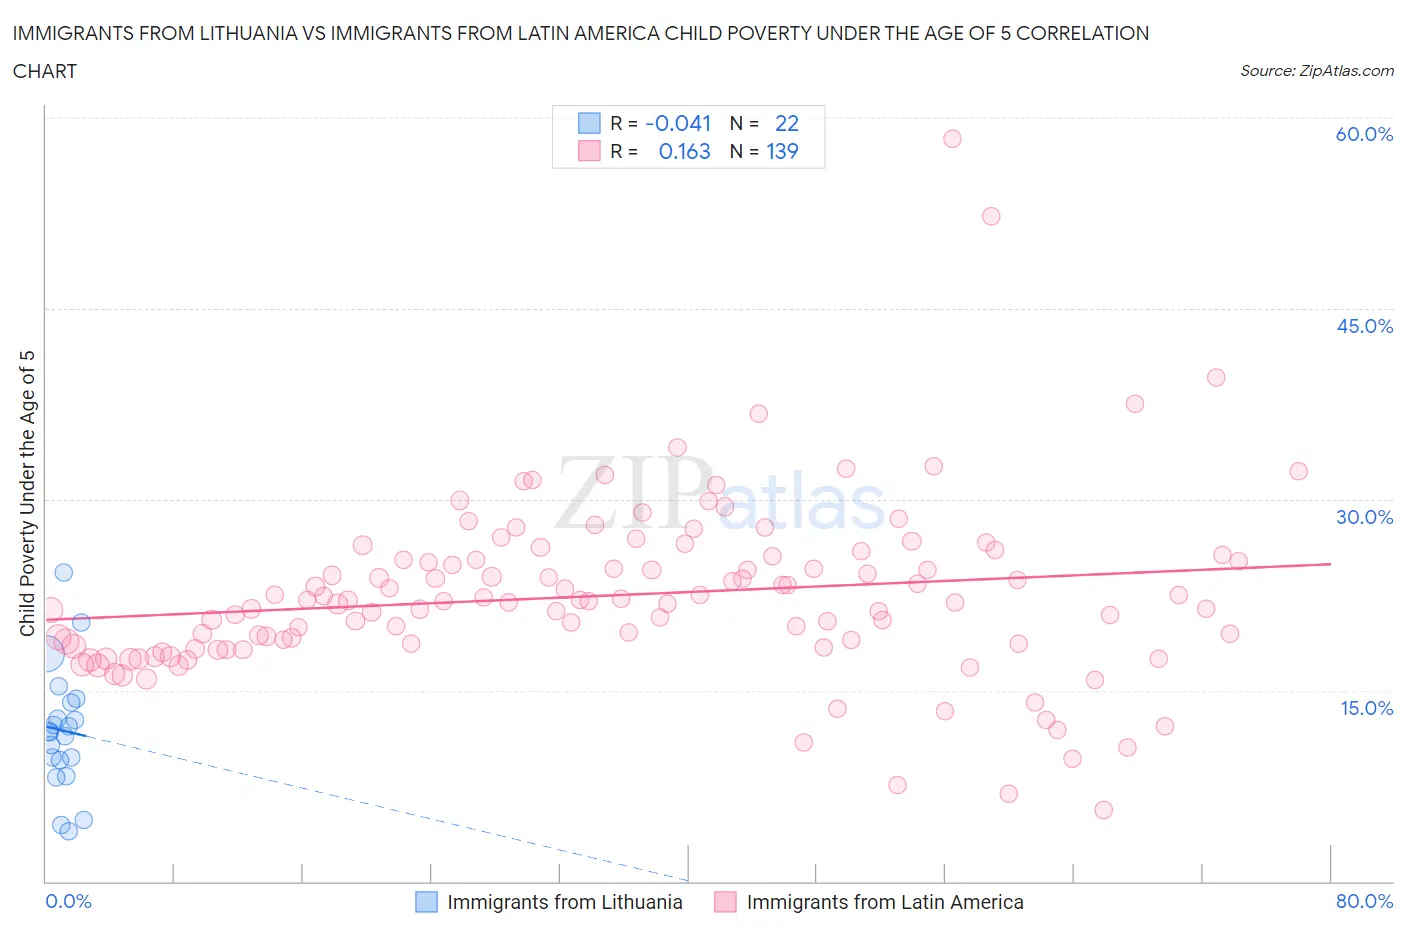
Immigrants from Lithuania vs Immigrants from Latin America Child Poverty Under the Age of 5 Correlation Chart
The statistical analysis conducted on geographies consisting of 114,250,981 people shows no correlation between the proportion of Immigrants from Lithuania and poverty level among children under the age of 5 in the United States with a correlation coefficient (R) of -0.041 and weighted average of 14.1%. Similarly, the statistical analysis conducted on geographies consisting of 523,296,541 people shows a poor positive correlation between the proportion of Immigrants from Latin America and poverty level among children under the age of 5 in the United States with a correlation coefficient (R) of 0.163 and weighted average of 21.2%, a difference of 50.6%.
Child Poverty Under the Age of 5 Correlation Summary
| Measurement | Immigrants from Lithuania | Immigrants from Latin America |
| Minimum | 3.9% | 5.6% |
| Maximum | 24.3% | 58.4% |
| Range | 20.4% | 52.7% |
| Mean | 11.8% | 22.5% |
| Median | 11.7% | 22.0% |
| Interquartile 25% (IQ1) | 9.6% | 18.5% |
| Interquartile 75% (IQ3) | 14.1% | 25.3% |
| Interquartile Range (IQR) | 4.5% | 6.8% |
| Standard Deviation (Sample) | 4.9% | 7.0% |
| Standard Deviation (Population) | 4.8% | 7.0% |
Similar Demographics by Child Poverty Under the Age of 5
Demographics Similar to Immigrants from Lithuania by Child Poverty Under the Age of 5
In terms of child poverty under the age of 5, the demographic groups most similar to Immigrants from Lithuania are Tongan (14.2%, a difference of 0.49%), Asian (14.0%, a difference of 0.93%), Cypriot (14.0%, a difference of 0.93%), Bulgarian (13.9%, a difference of 1.5%), and Immigrants from Indonesia (14.3%, a difference of 1.7%).
| Demographics | Rating | Rank | Child Poverty Under the Age of 5 |
| Immigrants | Ireland | 100.0 /100 | #19 | Exceptional 13.7% |
| Immigrants | Japan | 100.0 /100 | #20 | Exceptional 13.8% |
| Bolivians | 100.0 /100 | #21 | Exceptional 13.8% |
| Immigrants | Bolivia | 100.0 /100 | #22 | Exceptional 13.8% |
| Bulgarians | 99.9 /100 | #23 | Exceptional 13.9% |
| Asians | 99.9 /100 | #24 | Exceptional 14.0% |
| Cypriots | 99.9 /100 | #25 | Exceptional 14.0% |
| Immigrants | Lithuania | 99.9 /100 | #26 | Exceptional 14.1% |
| Tongans | 99.9 /100 | #27 | Exceptional 14.2% |
| Immigrants | Indonesia | 99.8 /100 | #28 | Exceptional 14.3% |
| Immigrants | Asia | 99.8 /100 | #29 | Exceptional 14.4% |
| Cambodians | 99.8 /100 | #30 | Exceptional 14.4% |
| Koreans | 99.8 /100 | #31 | Exceptional 14.4% |
| Immigrants | Sri Lanka | 99.8 /100 | #32 | Exceptional 14.4% |
| Taiwanese | 99.8 /100 | #33 | Exceptional 14.5% |
Demographics Similar to Immigrants from Latin America by Child Poverty Under the Age of 5
In terms of child poverty under the age of 5, the demographic groups most similar to Immigrants from Latin America are Haitian (21.2%, a difference of 0.080%), Immigrants from Zaire (21.3%, a difference of 0.090%), Immigrants from Senegal (21.3%, a difference of 0.27%), Immigrants from Haiti (21.3%, a difference of 0.34%), and Somali (21.1%, a difference of 0.55%).
| Demographics | Rating | Rank | Child Poverty Under the Age of 5 |
| Sub-Saharan Africans | 0.0 /100 | #279 | Tragic 20.8% |
| French American Indians | 0.0 /100 | #280 | Tragic 20.8% |
| Senegalese | 0.0 /100 | #281 | Tragic 20.9% |
| Potawatomi | 0.0 /100 | #282 | Tragic 21.0% |
| Comanche | 0.0 /100 | #283 | Tragic 21.0% |
| Somalis | 0.0 /100 | #284 | Tragic 21.1% |
| Haitians | 0.0 /100 | #285 | Tragic 21.2% |
| Immigrants | Latin America | 0.0 /100 | #286 | Tragic 21.2% |
| Immigrants | Zaire | 0.0 /100 | #287 | Tragic 21.3% |
| Immigrants | Senegal | 0.0 /100 | #288 | Tragic 21.3% |
| Immigrants | Haiti | 0.0 /100 | #289 | Tragic 21.3% |
| Immigrants | Caribbean | 0.0 /100 | #290 | Tragic 21.4% |
| British West Indians | 0.0 /100 | #291 | Tragic 21.4% |
| Immigrants | Somalia | 0.0 /100 | #292 | Tragic 21.6% |
| Mexicans | 0.0 /100 | #293 | Tragic 21.6% |