Immigrants from Lebanon vs Polish Single Father Poverty
COMPARE
Immigrants from Lebanon
Polish
Single Father Poverty
Single Father Poverty Comparison
Immigrants from Lebanon
Poles
17.9%
SINGLE FATHER POVERTY
0.0/ 100
METRIC RATING
285th/ 347
METRIC RANK
17.3%
SINGLE FATHER POVERTY
0.3/ 100
METRIC RATING
265th/ 347
METRIC RANK
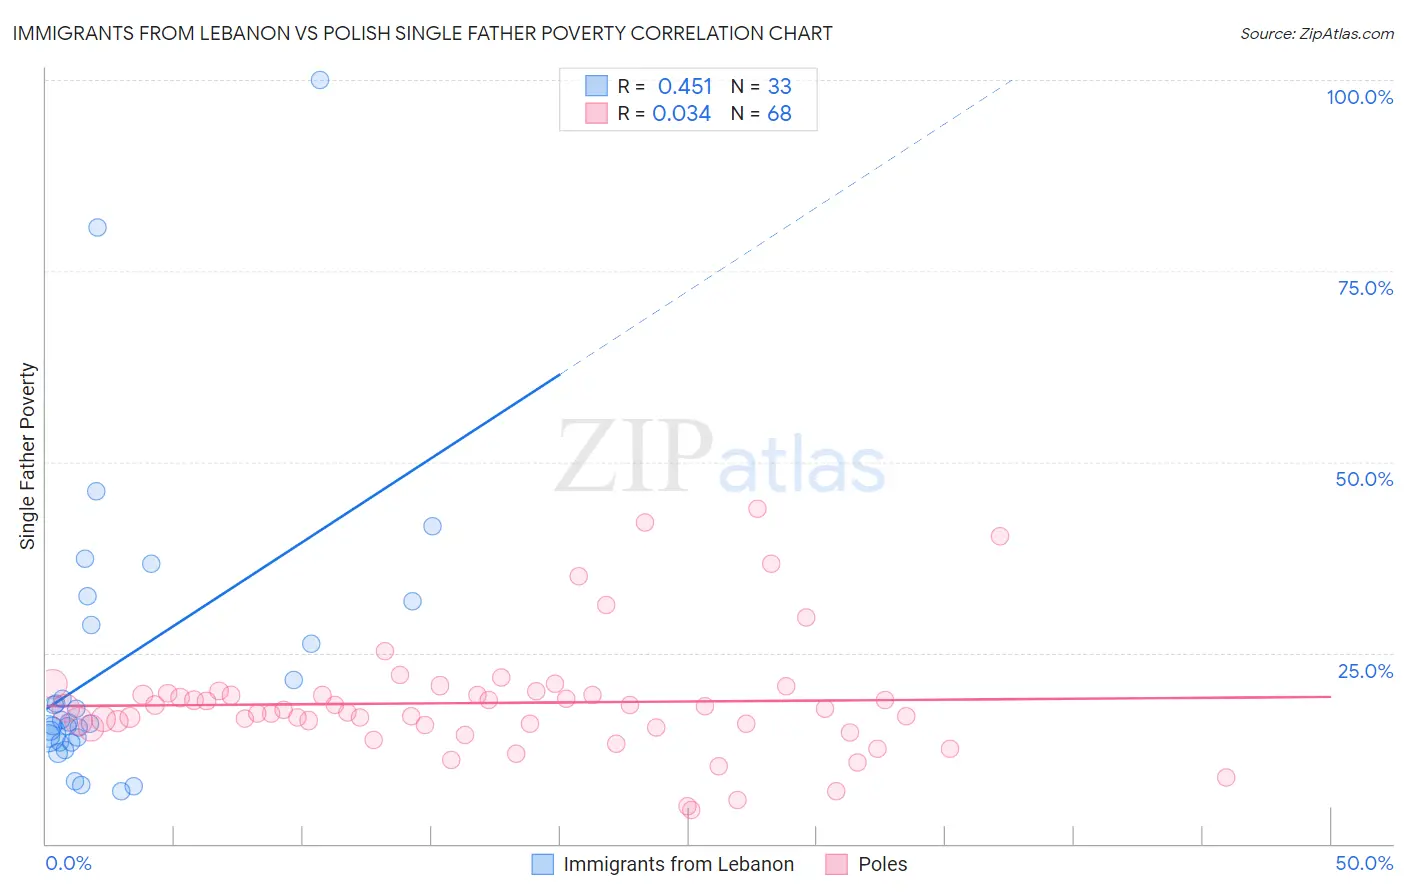
Immigrants from Lebanon vs Polish Single Father Poverty Correlation Chart
The statistical analysis conducted on geographies consisting of 180,091,576 people shows a moderate positive correlation between the proportion of Immigrants from Lebanon and poverty level among single fathers in the United States with a correlation coefficient (R) of 0.451 and weighted average of 17.9%. Similarly, the statistical analysis conducted on geographies consisting of 402,702,262 people shows no correlation between the proportion of Poles and poverty level among single fathers in the United States with a correlation coefficient (R) of 0.034 and weighted average of 17.3%, a difference of 3.3%.
Single Father Poverty Correlation Summary
| Measurement | Immigrants from Lebanon | Polish |
| Minimum | 6.9% | 4.5% |
| Maximum | 100.0% | 43.8% |
| Range | 93.1% | 39.4% |
| Mean | 23.9% | 18.4% |
| Median | 15.8% | 17.6% |
| Interquartile 25% (IQ1) | 13.6% | 15.4% |
| Interquartile 75% (IQ3) | 30.1% | 19.6% |
| Interquartile Range (IQR) | 16.5% | 4.2% |
| Standard Deviation (Sample) | 20.0% | 7.7% |
| Standard Deviation (Population) | 19.7% | 7.6% |
Demographics Similar to Immigrants from Lebanon and Poles by Single Father Poverty
In terms of single father poverty, the demographic groups most similar to Immigrants from Lebanon are Welsh (17.8%, a difference of 0.37%), Alsatian (17.8%, a difference of 0.38%), English (17.8%, a difference of 0.48%), Dutch (17.8%, a difference of 0.48%), and Scottish (17.7%, a difference of 0.80%). Similarly, the demographic groups most similar to Poles are Jamaican (17.3%, a difference of 0.060%), Haitian (17.3%, a difference of 0.090%), Immigrants from Caribbean (17.4%, a difference of 0.19%), Slavic (17.4%, a difference of 0.26%), and Indonesian (17.4%, a difference of 0.52%).
| Demographics | Rating | Rank | Single Father Poverty |
| Poles | 0.3 /100 | #265 | Tragic 17.3% |
| Jamaicans | 0.3 /100 | #266 | Tragic 17.3% |
| Haitians | 0.3 /100 | #267 | Tragic 17.3% |
| Immigrants | Caribbean | 0.3 /100 | #268 | Tragic 17.4% |
| Slavs | 0.3 /100 | #269 | Tragic 17.4% |
| Indonesians | 0.2 /100 | #270 | Tragic 17.4% |
| French American Indians | 0.2 /100 | #271 | Tragic 17.4% |
| Barbadians | 0.1 /100 | #272 | Tragic 17.5% |
| Italians | 0.1 /100 | #273 | Tragic 17.5% |
| Macedonians | 0.1 /100 | #274 | Tragic 17.7% |
| British West Indians | 0.0 /100 | #275 | Tragic 17.7% |
| German Russians | 0.0 /100 | #276 | Tragic 17.7% |
| Lebanese | 0.0 /100 | #277 | Tragic 17.7% |
| Germans | 0.0 /100 | #278 | Tragic 17.7% |
| Iroquois | 0.0 /100 | #279 | Tragic 17.7% |
| Scottish | 0.0 /100 | #280 | Tragic 17.7% |
| English | 0.0 /100 | #281 | Tragic 17.8% |
| Dutch | 0.0 /100 | #282 | Tragic 17.8% |
| Alsatians | 0.0 /100 | #283 | Tragic 17.8% |
| Welsh | 0.0 /100 | #284 | Tragic 17.8% |
| Immigrants | Lebanon | 0.0 /100 | #285 | Tragic 17.9% |