Immigrants from Latvia vs Immigrants from Netherlands Child Poverty Under the Age of 16

COMPARE

Immigrants from Latvia
Race
Ancestry
AfghanAfricanAlaska NativeAlaskan AthabascanAlbanianAleutAlsatianAmericanApacheArabArapahoArgentineanArmenianAssyrian/Chaldean/SyriacAustralianAustrianBahamianBangladeshiBarbadianBasqueBelgianBelizeanBermudanBhutaneseBlackfeetBolivianBrazilianBritishBritish West IndianBulgarianBurmeseCajunCambodianCanadianCape VerdeanCarpatho RusynCelticCentral AmericanCentral American IndianCherokeeCheyenneChickasawChileanChineseChippewaChoctawColombianColvilleComancheCosta RicanCreeCreekCroatianCrowCubanCypriotCzechCzechoslovakianDanishDelawareDominicanDutchDutch West IndianEastern EuropeanEcuadorianEgyptianEnglishEstonianEthiopianEuropeanFijianFilipinoFinnishFrenchFrench American IndianFrench CanadianGermanGerman RussianGhanaianGreekGuamanian/ChamorroGuatemalanGuyaneseHaitianHmongHonduranHopiHoumaHungarianIcelanderIndian (Asian)IndonesianInupiatIranianIraqiIrishIroquoisIsraeliItalianJamaicanJapaneseJordanianKenyanKiowaKoreanLaotianLatvianLebaneseLiberianLithuanianLumbeeLuxembourgerMacedonianMalaysianMalteseMarshalleseMenomineeMexicanMexican American IndianMongolianMoroccanNative HawaiianNavajoNepaleseNew ZealanderNicaraguanNigerianNorthern EuropeanNorwegianOkinawanOsageOttawaPaiutePakistaniPalestinianPanamanianParaguayanPennsylvania GermanPeruvianPimaPolishPortuguesePotawatomiPuebloPuerto RicanPuget Sound SalishRomanianRussianSalvadoranSamoanScandinavianScotch-IrishScottishSeminoleSenegaleseSerbianShoshoneSierra LeoneanSiouxSlavicSlovakSloveneSomaliSouth AfricanSouth AmericanSouth American IndianSoviet UnionSpaniardSpanishSpanish AmericanSpanish American IndianSri LankanSubsaharan AfricanSudaneseSwedishSwissSyrianTaiwaneseThaiTlingit-HaidaTohono O'OdhamTonganTrinidadian and TobagonianTsimshianTurkishU.S. Virgin IslanderUgandanUkrainianUruguayanUteVenezuelanVietnameseWelshWest IndianYakamaYaquiYugoslavianYumanYup'ikZimbabwean
Immigration
NonimmigrantsImmigrantsAfghanistanAfricaAlbaniaArgentinaArmeniaAsiaAustraliaAustriaBahamasBangladeshBarbadosBelarusBelgiumBelizeBoliviaBosnia and HerzegovinaBrazilBulgariaBurma/MyanmarCabo VerdeCambodiaCameroonCanadaCaribbeanCentral AmericaChileChinaColombiaCongoCosta RicaCroatiaCubaCzechoslovakiaDenmarkDominicaDominican RepublicEastern AfricaEastern AsiaEastern EuropeEcuadorEgyptEl SalvadorEnglandEritreaEthiopiaEuropeFijiFranceGermanyGhanaGreeceGrenadaGuatemalaGuyanaHaitiHondurasHong KongHungaryIndiaIndonesiaIranIraqIrelandIsraelItalyJamaicaJapanJordanKazakhstanKenyaKoreaKuwaitLaosLatin AmericaLatviaLebanonLiberiaLithuaniaMalaysiaMexicoMicronesiaMiddle AfricaMoldovaMoroccoNepalNicaraguaNigeriaNorth AmericaNorth MacedoniaNorthern AfricaNorthern EuropeNorwayOceaniaPakistanPanamaPeruPhilippinesPolandPortugalRomaniaRussiaSaudi ArabiaScotlandSenegalSerbiaSierra LeoneSingaporeSomaliaSouth AfricaSouth AmericaSouth Central AsiaSouth Eastern AsiaSouthern EuropeSpainSri LankaSt. Vincent and the GrenadinesSudanSwedenSwitzerlandSyriaTaiwanThailandTrinidad and TobagoTurkeyUgandaUkraineUruguayUzbekistanVenezuelaVietnamWest IndiesWestern AfricaWestern AsiaWestern EuropeYemenZaireZimbabweAzores
Immigrants from Netherlands
Race
Ancestry
AfghanAfricanAlaska NativeAlaskan AthabascanAlbanianAleutAlsatianAmericanApacheArabArapahoArgentineanArmenianAssyrian/Chaldean/SyriacAustralianAustrianBahamianBangladeshiBarbadianBasqueBelgianBelizeanBermudanBhutaneseBlackfeetBolivianBrazilianBritishBritish West IndianBulgarianBurmeseCajunCambodianCanadianCape VerdeanCarpatho RusynCelticCentral AmericanCentral American IndianCherokeeCheyenneChickasawChileanChineseChippewaChoctawColombianColvilleComancheCosta RicanCreeCreekCroatianCrowCubanCypriotCzechCzechoslovakianDanishDelawareDominicanDutchDutch West IndianEastern EuropeanEcuadorianEgyptianEnglishEstonianEthiopianEuropeanFijianFilipinoFinnishFrenchFrench American IndianFrench CanadianGermanGerman RussianGhanaianGreekGuamanian/ChamorroGuatemalanGuyaneseHaitianHmongHonduranHopiHoumaHungarianIcelanderIndian (Asian)IndonesianInupiatIranianIraqiIrishIroquoisIsraeliItalianJamaicanJapaneseJordanianKenyanKiowaKoreanLaotianLatvianLebaneseLiberianLithuanianLumbeeLuxembourgerMacedonianMalaysianMalteseMarshalleseMenomineeMexicanMexican American IndianMongolianMoroccanNative HawaiianNavajoNepaleseNew ZealanderNicaraguanNigerianNorthern EuropeanNorwegianOkinawanOsageOttawaPaiutePakistaniPalestinianPanamanianParaguayanPennsylvania GermanPeruvianPimaPolishPortuguesePotawatomiPuebloPuerto RicanPuget Sound SalishRomanianRussianSalvadoranSamoanScandinavianScotch-IrishScottishSeminoleSenegaleseSerbianShoshoneSierra LeoneanSiouxSlavicSlovakSloveneSomaliSouth AfricanSouth AmericanSouth American IndianSoviet UnionSpaniardSpanishSpanish AmericanSpanish American IndianSri LankanSubsaharan AfricanSudaneseSwedishSwissSyrianTaiwaneseThaiTlingit-HaidaTohono O'OdhamTonganTrinidadian and TobagonianTsimshianTurkishU.S. Virgin IslanderUgandanUkrainianUruguayanUteVenezuelanVietnameseWelshWest IndianYakamaYaquiYugoslavianYumanYup'ikZimbabwean
Immigration
NonimmigrantsImmigrantsAfghanistanAfricaAlbaniaArgentinaArmeniaAsiaAustraliaAustriaBahamasBangladeshBarbadosBelarusBelgiumBelizeBoliviaBosnia and HerzegovinaBrazilBulgariaBurma/MyanmarCabo VerdeCambodiaCameroonCanadaCaribbeanCentral AmericaChileChinaColombiaCongoCosta RicaCroatiaCubaCzechoslovakiaDenmarkDominicaDominican RepublicEastern AfricaEastern AsiaEastern EuropeEcuadorEgyptEl SalvadorEnglandEritreaEthiopiaEuropeFijiFranceGermanyGhanaGreeceGrenadaGuatemalaGuyanaHaitiHondurasHong KongHungaryIndiaIndonesiaIranIraqIrelandIsraelItalyJamaicaJapanJordanKazakhstanKenyaKoreaKuwaitLaosLatin AmericaLebanonLiberiaLithuaniaMalaysiaMexicoMicronesiaMiddle AfricaMoldovaMoroccoNepalNetherlandsNicaraguaNigeriaNorth AmericaNorth MacedoniaNorthern AfricaNorthern EuropeNorwayOceaniaPakistanPanamaPeruPhilippinesPolandPortugalRomaniaRussiaSaudi ArabiaScotlandSenegalSerbiaSierra LeoneSingaporeSomaliaSouth AfricaSouth AmericaSouth Central AsiaSouth Eastern AsiaSouthern EuropeSpainSri LankaSt. Vincent and the GrenadinesSudanSwedenSwitzerlandSyriaTaiwanThailandTrinidad and TobagoTurkeyUgandaUkraineUruguayUzbekistanVenezuelaVietnamWest IndiesWestern AfricaWestern AsiaWestern EuropeYemenZaireZimbabweAzores
Child Poverty Under the Age of 16
Income
Poverty
Unemployment
Labor Participation
Family Structure
Vehicle Availability
Education Level
Disability

Child Poverty Under the Age of 16 Comparison

Immigrants from Latvia

Immigrants from Netherlands

Exceptional
Exceptional
14.5%
CHILD POVERTY UNDER THE AGE OF 16
97.1/ 100
METRIC RATING
84th/ 347
METRIC RANK
14.3%
CHILD POVERTY UNDER THE AGE OF 16
97.9/ 100
METRIC RATING
70th/ 347
METRIC RANK

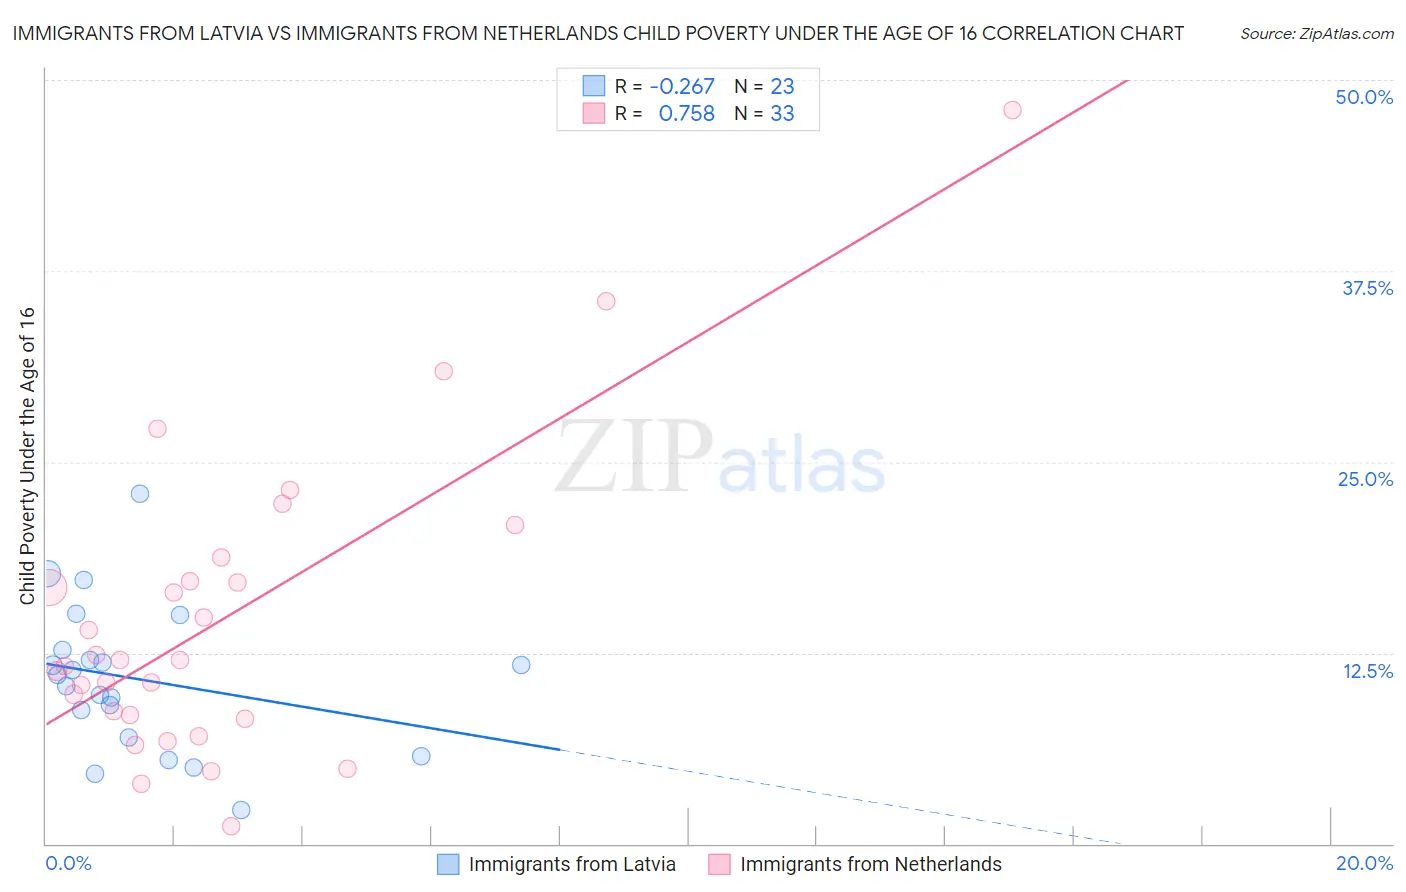
Immigrants from Latvia vs Immigrants from Netherlands Child Poverty Under the Age of 16 Correlation Chart

The statistical analysis conducted on geographies consisting of 113,191,371 people shows a weak negative correlation between the proportion of Immigrants from Latvia and poverty level among children under the age of 16 in the United States with a correlation coefficient (R) of -0.267 and weighted average of 14.5%. Similarly, the statistical analysis conducted on geographies consisting of 236,076,675 people shows a strong positive correlation between the proportion of Immigrants from Netherlands and poverty level among children under the age of 16 in the United States with a correlation coefficient (R) of 0.758 and weighted average of 14.3%, a difference of 1.1%.
Immigrants from Latvia vs Immigrants from Netherlands Child Poverty Under the Age of 16

Child Poverty Under the Age of 16 Correlation Summary

MeasurementImmigrants from LatviaImmigrants from Netherlands
Minimum2.2%1.1%
Maximum22.9%48.1%
Range20.7%46.9%
Mean10.8%14.7%
Median11.1%12.0%
Interquartile 25% (IQ1)7.0%8.3%
Interquartile 75% (IQ3)12.7%17.9%
Interquartile Range (IQR)5.7%9.6%
Standard Deviation (Sample)4.8%9.8%
Standard Deviation (Population)4.7%9.7%

Demographics Similar to Immigrants from Latvia and Immigrants from Netherlands by Child Poverty Under the Age of 16

In terms of child poverty under the age of 16, the demographic groups most similar to Immigrants from Latvia are Egyptian (14.5%, a difference of 0.020%), Soviet Union (14.5%, a difference of 0.020%), Immigrants from Canada (14.5%, a difference of 0.050%), Finnish (14.5%, a difference of 0.080%), and Immigrants from Argentina (14.5%, a difference of 0.10%). Similarly, the demographic groups most similar to Immigrants from Netherlands are Immigrants from Poland (14.3%, a difference of 0.0%), Immigrants from Bulgaria (14.3%, a difference of 0.10%), Laotian (14.3%, a difference of 0.18%), Cambodian (14.4%, a difference of 0.23%), and European (14.3%, a difference of 0.28%).
DemographicsRating | RankChild Poverty Under the Age of 16
Europeans
98.1
/100
|
#67
Exceptional
14.3%
Laotians
98.0
/100
|
#68
Exceptional
14.3%
Immigrants | Bulgaria
98.0
/100
|
#69
Exceptional
14.3%
Immigrants | Netherlands
97.9
/100
|
#70
Exceptional
14.3%
Immigrants | Poland
97.9
/100
|
#71
Exceptional
14.3%
Cambodians
97.8
/100
|
#72
Exceptional
14.4%
Immigrants | Turkey
97.6
/100
|
#73
Exceptional
14.4%
Macedonians
97.6
/100
|
#74
Exceptional
14.4%
Ukrainians
97.5
/100
|
#75
Exceptional
14.4%
Immigrants | Eastern Europe
97.5
/100
|
#76
Exceptional
14.4%
Australians
97.5
/100
|
#77
Exceptional
14.4%
Immigrants | Russia
97.3
/100
|
#78
Exceptional
14.5%
Swiss
97.3
/100
|
#79
Exceptional
14.5%
Immigrants | North Macedonia
97.2
/100
|
#80
Exceptional
14.5%
Finns
97.2
/100
|
#81
Exceptional
14.5%
Immigrants | Canada
97.2
/100
|
#82
Exceptional
14.5%
Egyptians
97.2
/100
|
#83
Exceptional
14.5%
Immigrants | Latvia
97.1
/100
|
#84
Exceptional
14.5%
Soviet Union
97.1
/100
|
#85
Exceptional
14.5%
Immigrants | Argentina
97.1
/100
|
#86
Exceptional
14.5%
Taiwanese
97.1
/100
|
#87
Exceptional
14.5%