Immigrants from Laos vs Immigrants from Nigeria Child Poverty Under the Age of 16
COMPARE
Immigrants from Laos
Immigrants from Nigeria
Child Poverty Under the Age of 16
Child Poverty Under the Age of 16 Comparison
Immigrants from Laos
Immigrants from Nigeria
18.7%
CHILD POVERTY UNDER THE AGE OF 16
0.6/ 100
METRIC RATING
242nd/ 347
METRIC RANK
18.4%
CHILD POVERTY UNDER THE AGE OF 16
1.0/ 100
METRIC RATING
234th/ 347
METRIC RANK
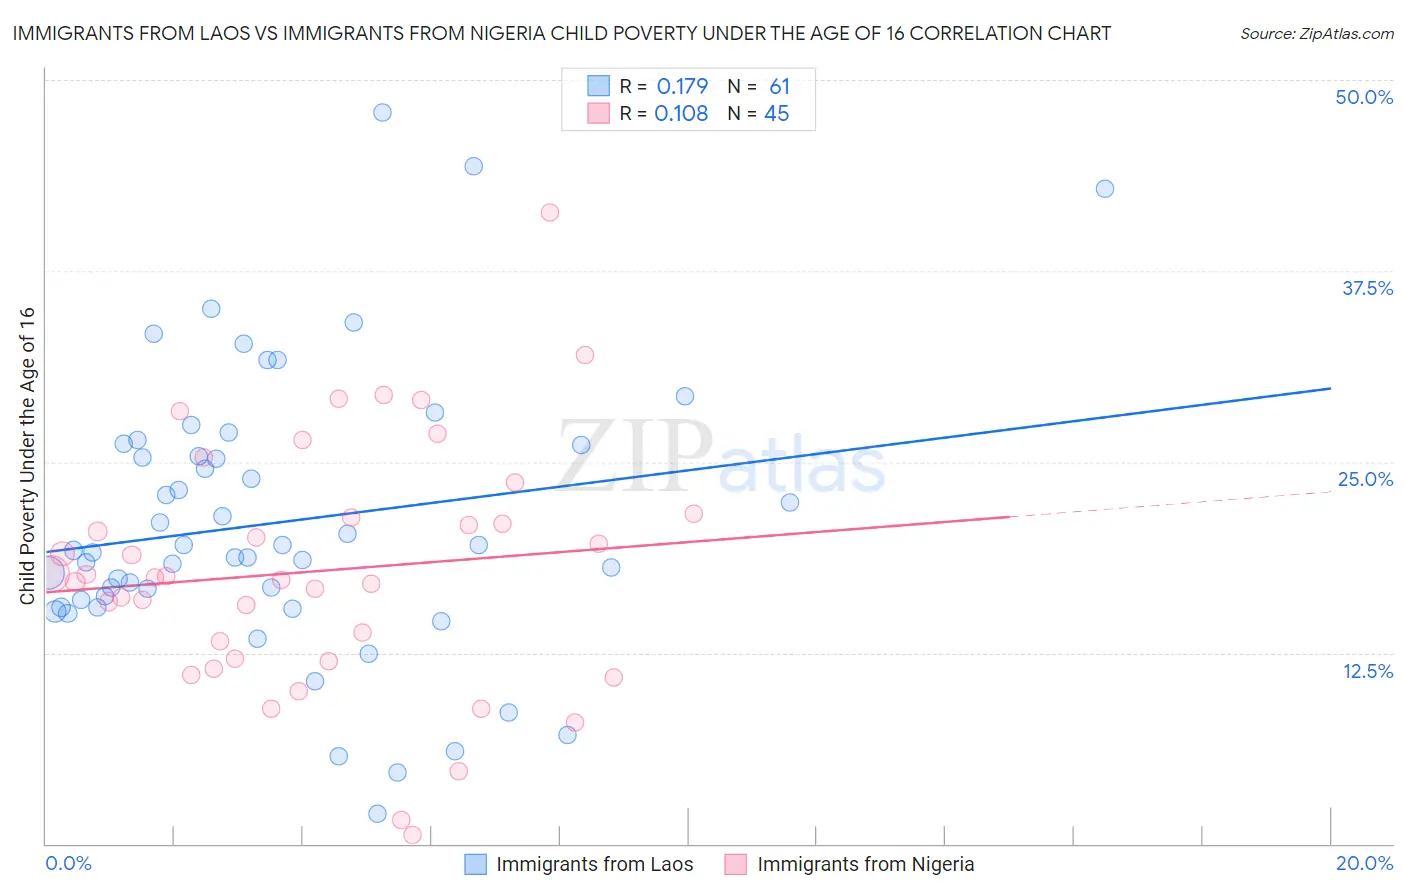
Immigrants from Laos vs Immigrants from Nigeria Child Poverty Under the Age of 16 Correlation Chart
The statistical analysis conducted on geographies consisting of 200,797,762 people shows a poor positive correlation between the proportion of Immigrants from Laos and poverty level among children under the age of 16 in the United States with a correlation coefficient (R) of 0.179 and weighted average of 18.7%. Similarly, the statistical analysis conducted on geographies consisting of 282,103,392 people shows a poor positive correlation between the proportion of Immigrants from Nigeria and poverty level among children under the age of 16 in the United States with a correlation coefficient (R) of 0.108 and weighted average of 18.4%, a difference of 1.3%.
Child Poverty Under the Age of 16 Correlation Summary
| Measurement | Immigrants from Laos | Immigrants from Nigeria |
| Minimum | 2.0% | 0.58% |
| Maximum | 47.9% | 41.3% |
| Range | 45.9% | 40.8% |
| Mean | 21.0% | 17.8% |
| Median | 19.2% | 17.4% |
| Interquartile 25% (IQ1) | 15.7% | 12.0% |
| Interquartile 75% (IQ3) | 26.1% | 21.5% |
| Interquartile Range (IQR) | 10.4% | 9.5% |
| Standard Deviation (Sample) | 9.2% | 8.1% |
| Standard Deviation (Population) | 9.1% | 8.0% |
Demographics Similar to Immigrants from Laos and Immigrants from Nigeria by Child Poverty Under the Age of 16
In terms of child poverty under the age of 16, the demographic groups most similar to Immigrants from Laos are Alsatian (18.6%, a difference of 0.11%), Immigrants from Cuba (18.7%, a difference of 0.13%), Cape Verdean (18.7%, a difference of 0.20%), Ghanaian (18.6%, a difference of 0.58%), and Immigrants from Sudan (18.5%, a difference of 0.63%). Similarly, the demographic groups most similar to Immigrants from Nigeria are Nigerian (18.4%, a difference of 0.060%), Fijian (18.4%, a difference of 0.25%), Cree (18.5%, a difference of 0.35%), Sudanese (18.5%, a difference of 0.38%), and American (18.3%, a difference of 0.47%).
| Demographics | Rating | Rank | Child Poverty Under the Age of 16 |
| Immigrants | Micronesia | 2.3 /100 | #228 | Tragic 18.0% |
| Marshallese | 1.8 /100 | #229 | Tragic 18.1% |
| Nepalese | 1.7 /100 | #230 | Tragic 18.2% |
| Nicaraguans | 1.7 /100 | #231 | Tragic 18.2% |
| Americans | 1.2 /100 | #232 | Tragic 18.3% |
| Fijians | 1.1 /100 | #233 | Tragic 18.4% |
| Immigrants | Nigeria | 1.0 /100 | #234 | Tragic 18.4% |
| Nigerians | 1.0 /100 | #235 | Tragic 18.4% |
| Cree | 0.9 /100 | #236 | Tragic 18.5% |
| Sudanese | 0.9 /100 | #237 | Tragic 18.5% |
| Immigrants | Eritrea | 0.8 /100 | #238 | Tragic 18.5% |
| Immigrants | Sudan | 0.8 /100 | #239 | Tragic 18.5% |
| Ghanaians | 0.8 /100 | #240 | Tragic 18.6% |
| Alsatians | 0.7 /100 | #241 | Tragic 18.6% |
| Immigrants | Laos | 0.6 /100 | #242 | Tragic 18.7% |
| Immigrants | Cuba | 0.6 /100 | #243 | Tragic 18.7% |
| Cape Verdeans | 0.6 /100 | #244 | Tragic 18.7% |
| Shoshone | 0.5 /100 | #245 | Tragic 18.8% |
| Immigrants | Nicaragua | 0.4 /100 | #246 | Tragic 18.8% |
| French American Indians | 0.4 /100 | #247 | Tragic 18.9% |
| Ecuadorians | 0.3 /100 | #248 | Tragic 19.0% |