Immigrants from Kuwait vs Alaskan Athabascan Female Poverty Among 18-24 Year Olds
COMPARE
Immigrants from Kuwait
Alaskan Athabascan
Female Poverty Among 18-24 Year Olds
Female Poverty Among 18-24 Year Olds Comparison
Immigrants from Kuwait
Alaskan Athabascans
23.0%
FEMALE POVERTY AMONG 18-24 YEAR OLDS
0.0/ 100
METRIC RATING
305th/ 347
METRIC RANK
22.5%
FEMALE POVERTY AMONG 18-24 YEAR OLDS
0.0/ 100
METRIC RATING
292nd/ 347
METRIC RANK
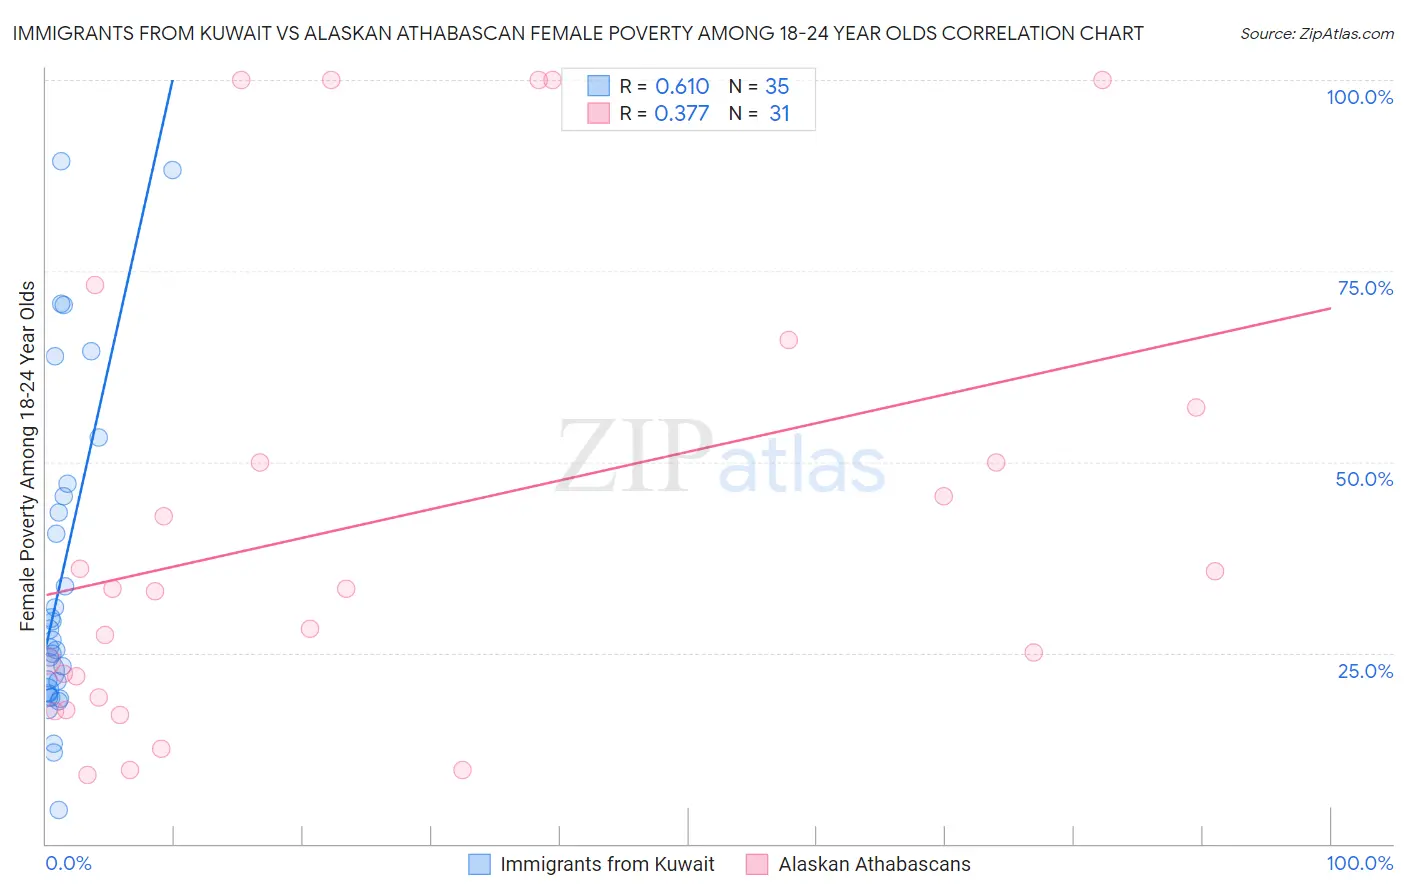
Immigrants from Kuwait vs Alaskan Athabascan Female Poverty Among 18-24 Year Olds Correlation Chart
The statistical analysis conducted on geographies consisting of 136,006,240 people shows a significant positive correlation between the proportion of Immigrants from Kuwait and poverty level among females between the ages 18 and 24 in the United States with a correlation coefficient (R) of 0.610 and weighted average of 23.0%. Similarly, the statistical analysis conducted on geographies consisting of 45,408,377 people shows a mild positive correlation between the proportion of Alaskan Athabascans and poverty level among females between the ages 18 and 24 in the United States with a correlation coefficient (R) of 0.377 and weighted average of 22.5%, a difference of 2.5%.
Female Poverty Among 18-24 Year Olds Correlation Summary
| Measurement | Immigrants from Kuwait | Alaskan Athabascan |
| Minimum | 4.4% | 9.0% |
| Maximum | 89.4% | 100.0% |
| Range | 85.0% | 91.0% |
| Mean | 34.5% | 42.5% |
| Median | 25.6% | 33.3% |
| Interquartile 25% (IQ1) | 19.6% | 19.2% |
| Interquartile 75% (IQ3) | 45.5% | 57.1% |
| Interquartile Range (IQR) | 25.9% | 37.9% |
| Standard Deviation (Sample) | 21.5% | 30.1% |
| Standard Deviation (Population) | 21.2% | 29.7% |
Demographics Similar to Immigrants from Kuwait and Alaskan Athabascans by Female Poverty Among 18-24 Year Olds
In terms of female poverty among 18-24 year olds, the demographic groups most similar to Immigrants from Kuwait are Sudanese (23.0%, a difference of 0.050%), Senegalese (23.0%, a difference of 0.19%), Iroquois (22.9%, a difference of 0.35%), Seminole (22.9%, a difference of 0.74%), and African (22.8%, a difference of 0.83%). Similarly, the demographic groups most similar to Alaskan Athabascans are U.S. Virgin Islander (22.5%, a difference of 0.030%), Bangladeshi (22.5%, a difference of 0.050%), Indonesian (22.5%, a difference of 0.070%), Shoshone (22.5%, a difference of 0.19%), and Menominee (22.5%, a difference of 0.30%).
| Demographics | Rating | Rank | Female Poverty Among 18-24 Year Olds |
| Dominicans | 0.0 /100 | #288 | Tragic 22.3% |
| French American Indians | 0.0 /100 | #289 | Tragic 22.3% |
| Immigrants | Senegal | 0.0 /100 | #290 | Tragic 22.4% |
| Bangladeshis | 0.0 /100 | #291 | Tragic 22.5% |
| Alaskan Athabascans | 0.0 /100 | #292 | Tragic 22.5% |
| U.S. Virgin Islanders | 0.0 /100 | #293 | Tragic 22.5% |
| Indonesians | 0.0 /100 | #294 | Tragic 22.5% |
| Shoshone | 0.0 /100 | #295 | Tragic 22.5% |
| Menominee | 0.0 /100 | #296 | Tragic 22.5% |
| Inupiat | 0.0 /100 | #297 | Tragic 22.6% |
| Central American Indians | 0.0 /100 | #298 | Tragic 22.6% |
| Cherokee | 0.0 /100 | #299 | Tragic 22.7% |
| Africans | 0.0 /100 | #300 | Tragic 22.8% |
| Seminole | 0.0 /100 | #301 | Tragic 22.9% |
| Iroquois | 0.0 /100 | #302 | Tragic 22.9% |
| Senegalese | 0.0 /100 | #303 | Tragic 23.0% |
| Sudanese | 0.0 /100 | #304 | Tragic 23.0% |
| Immigrants | Kuwait | 0.0 /100 | #305 | Tragic 23.0% |
| Paiute | 0.0 /100 | #306 | Tragic 23.3% |
| Cree | 0.0 /100 | #307 | Tragic 23.4% |
| Immigrants | Sudan | 0.0 /100 | #308 | Tragic 23.5% |