Immigrants from Kenya vs Shoshone Female Poverty Among 18-24 Year Olds
COMPARE
Immigrants from Kenya
Shoshone
Female Poverty Among 18-24 Year Olds
Female Poverty Among 18-24 Year Olds Comparison
Immigrants from Kenya
Shoshone
21.0%
FEMALE POVERTY AMONG 18-24 YEAR OLDS
2.5/ 100
METRIC RATING
248th/ 347
METRIC RANK
22.5%
FEMALE POVERTY AMONG 18-24 YEAR OLDS
0.0/ 100
METRIC RATING
295th/ 347
METRIC RANK
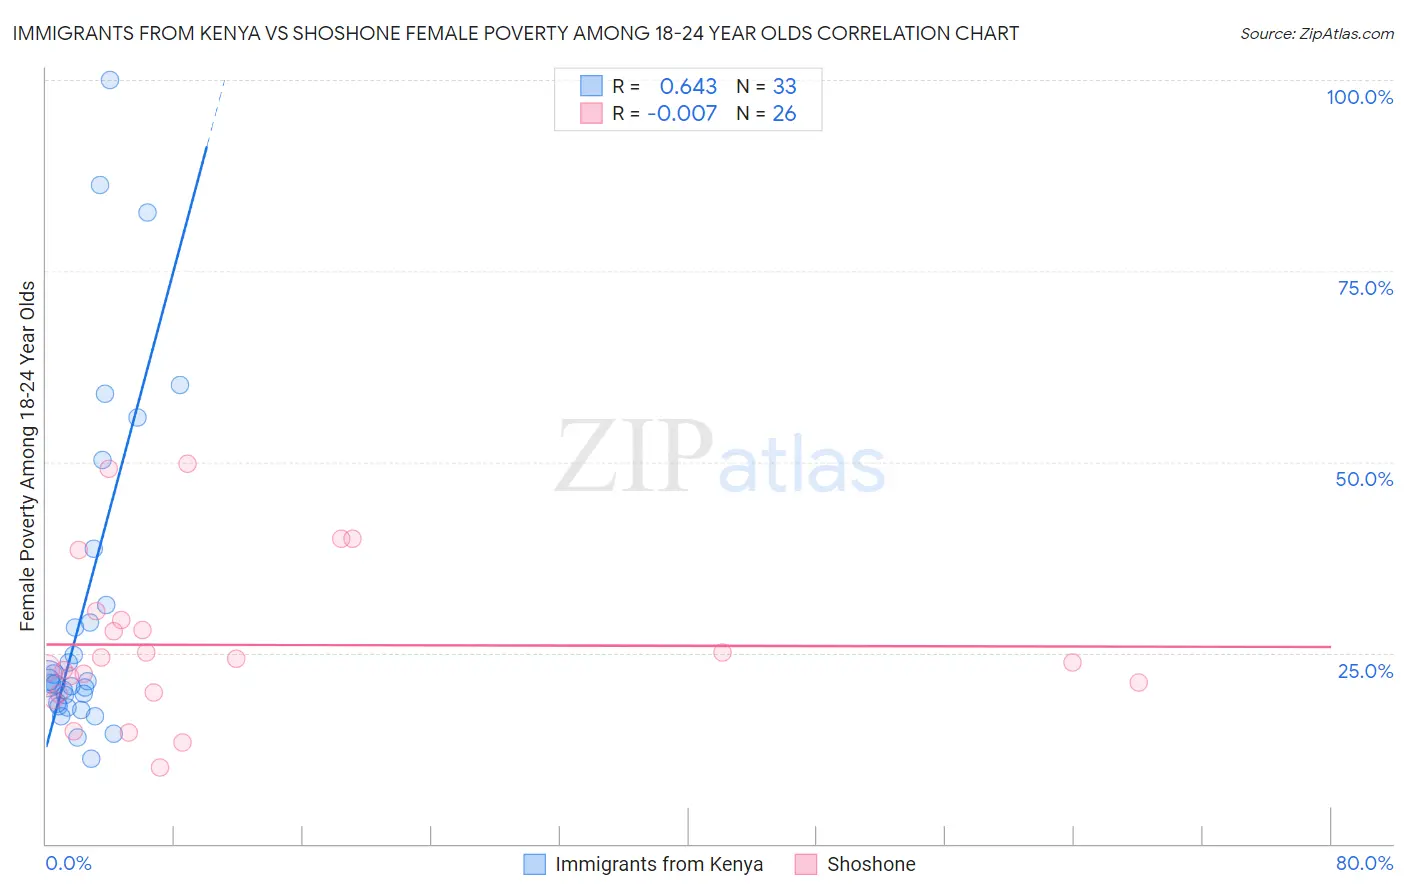
Immigrants from Kenya vs Shoshone Female Poverty Among 18-24 Year Olds Correlation Chart
The statistical analysis conducted on geographies consisting of 215,781,143 people shows a significant positive correlation between the proportion of Immigrants from Kenya and poverty level among females between the ages 18 and 24 in the United States with a correlation coefficient (R) of 0.643 and weighted average of 21.0%. Similarly, the statistical analysis conducted on geographies consisting of 66,235,554 people shows no correlation between the proportion of Shoshone and poverty level among females between the ages 18 and 24 in the United States with a correlation coefficient (R) of -0.007 and weighted average of 22.5%, a difference of 7.2%.
Female Poverty Among 18-24 Year Olds Correlation Summary
| Measurement | Immigrants from Kenya | Shoshone |
| Minimum | 11.2% | 10.0% |
| Maximum | 100.0% | 49.7% |
| Range | 88.8% | 39.7% |
| Mean | 31.6% | 26.0% |
| Median | 21.2% | 24.0% |
| Interquartile 25% (IQ1) | 18.2% | 19.7% |
| Interquartile 75% (IQ3) | 35.0% | 29.4% |
| Interquartile Range (IQR) | 16.7% | 9.6% |
| Standard Deviation (Sample) | 22.7% | 10.2% |
| Standard Deviation (Population) | 22.3% | 10.0% |
Similar Demographics by Female Poverty Among 18-24 Year Olds
Demographics Similar to Immigrants from Kenya by Female Poverty Among 18-24 Year Olds
In terms of female poverty among 18-24 year olds, the demographic groups most similar to Immigrants from Kenya are Carpatho Rusyn (21.0%, a difference of 0.020%), Immigrants from West Indies (21.0%, a difference of 0.15%), Immigrants from Africa (21.0%, a difference of 0.20%), Immigrants from Australia (20.9%, a difference of 0.25%), and Aleut (20.9%, a difference of 0.33%).
| Demographics | Rating | Rank | Female Poverty Among 18-24 Year Olds |
| Immigrants | Eritrea | 4.2 /100 | #241 | Tragic 20.9% |
| Israelis | 4.1 /100 | #242 | Tragic 20.9% |
| Marshallese | 3.4 /100 | #243 | Tragic 20.9% |
| Immigrants | Thailand | 3.4 /100 | #244 | Tragic 20.9% |
| Aleuts | 3.3 /100 | #245 | Tragic 20.9% |
| Immigrants | Australia | 3.1 /100 | #246 | Tragic 20.9% |
| Immigrants | Africa | 3.0 /100 | #247 | Tragic 21.0% |
| Immigrants | Kenya | 2.5 /100 | #248 | Tragic 21.0% |
| Carpatho Rusyns | 2.5 /100 | #249 | Tragic 21.0% |
| Immigrants | West Indies | 2.2 /100 | #250 | Tragic 21.0% |
| West Indians | 1.9 /100 | #251 | Tragic 21.1% |
| South Africans | 1.6 /100 | #252 | Tragic 21.1% |
| Delaware | 1.6 /100 | #253 | Tragic 21.1% |
| British West Indians | 1.2 /100 | #254 | Tragic 21.2% |
| Immigrants | Grenada | 1.2 /100 | #255 | Tragic 21.2% |
Demographics Similar to Shoshone by Female Poverty Among 18-24 Year Olds
In terms of female poverty among 18-24 year olds, the demographic groups most similar to Shoshone are Menominee (22.5%, a difference of 0.11%), Indonesian (22.5%, a difference of 0.12%), U.S. Virgin Islander (22.5%, a difference of 0.16%), Alaskan Athabascan (22.5%, a difference of 0.19%), and Bangladeshi (22.5%, a difference of 0.24%).
| Demographics | Rating | Rank | Female Poverty Among 18-24 Year Olds |
| Dominicans | 0.0 /100 | #288 | Tragic 22.3% |
| French American Indians | 0.0 /100 | #289 | Tragic 22.3% |
| Immigrants | Senegal | 0.0 /100 | #290 | Tragic 22.4% |
| Bangladeshis | 0.0 /100 | #291 | Tragic 22.5% |
| Alaskan Athabascans | 0.0 /100 | #292 | Tragic 22.5% |
| U.S. Virgin Islanders | 0.0 /100 | #293 | Tragic 22.5% |
| Indonesians | 0.0 /100 | #294 | Tragic 22.5% |
| Shoshone | 0.0 /100 | #295 | Tragic 22.5% |
| Menominee | 0.0 /100 | #296 | Tragic 22.5% |
| Inupiat | 0.0 /100 | #297 | Tragic 22.6% |
| Central American Indians | 0.0 /100 | #298 | Tragic 22.6% |
| Cherokee | 0.0 /100 | #299 | Tragic 22.7% |
| Africans | 0.0 /100 | #300 | Tragic 22.8% |
| Seminole | 0.0 /100 | #301 | Tragic 22.9% |
| Iroquois | 0.0 /100 | #302 | Tragic 22.9% |