Immigrants from Kenya vs Ottawa Male Poverty
COMPARE
Immigrants from Kenya
Ottawa
Male Poverty
Male Poverty Comparison
Immigrants from Kenya
Ottawa
11.6%
MALE POVERTY
16.1/ 100
METRIC RATING
194th/ 347
METRIC RANK
13.1%
MALE POVERTY
0.1/ 100
METRIC RATING
260th/ 347
METRIC RANK
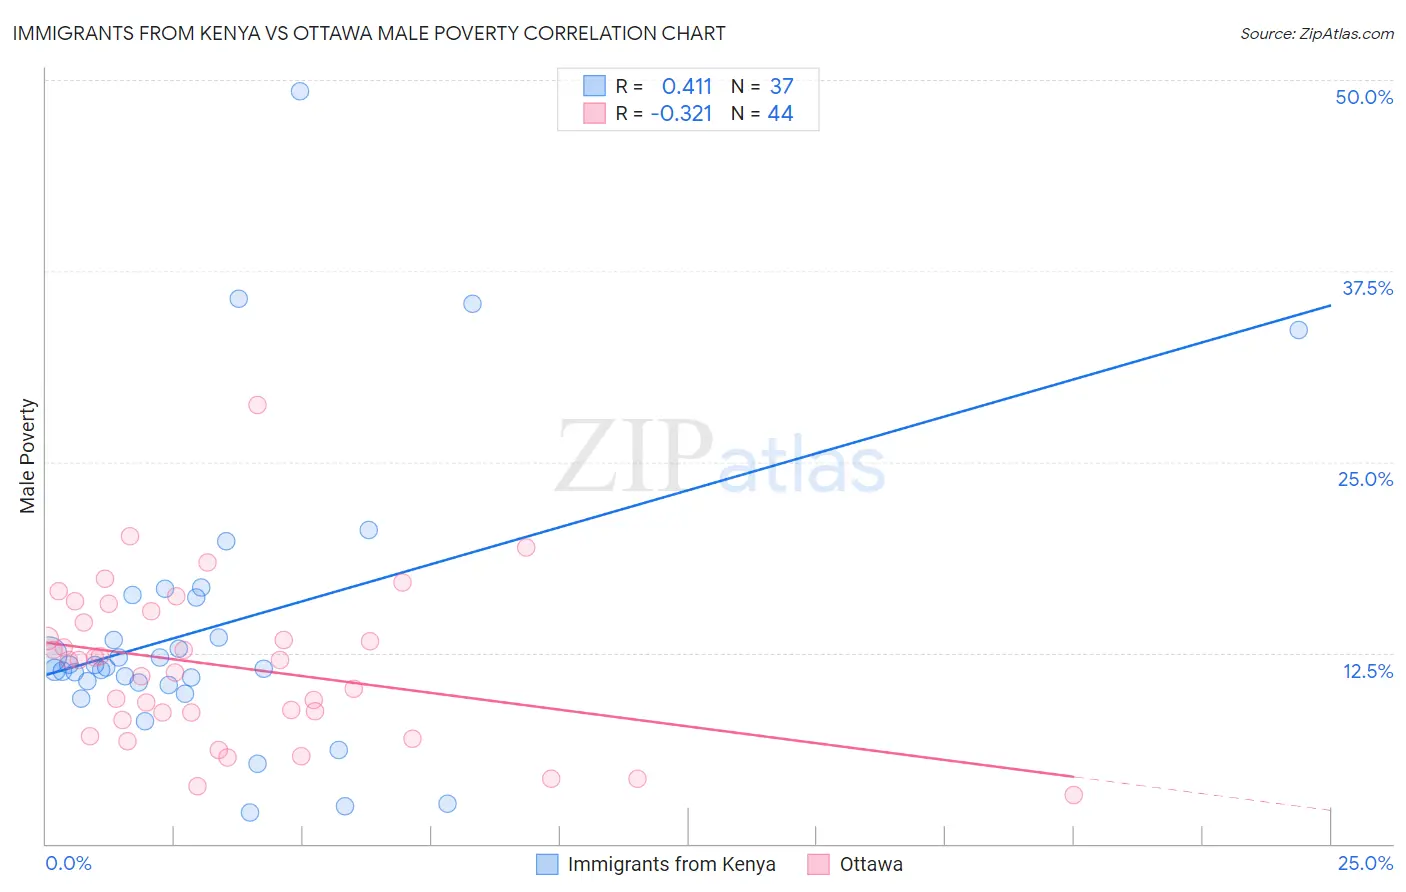
Immigrants from Kenya vs Ottawa Male Poverty Correlation Chart
The statistical analysis conducted on geographies consisting of 217,973,152 people shows a moderate positive correlation between the proportion of Immigrants from Kenya and poverty level among males in the United States with a correlation coefficient (R) of 0.411 and weighted average of 11.6%. Similarly, the statistical analysis conducted on geographies consisting of 49,944,189 people shows a mild negative correlation between the proportion of Ottawa and poverty level among males in the United States with a correlation coefficient (R) of -0.321 and weighted average of 13.1%, a difference of 12.6%.
Male Poverty Correlation Summary
| Measurement | Immigrants from Kenya | Ottawa |
| Minimum | 2.1% | 3.2% |
| Maximum | 49.2% | 28.7% |
| Range | 47.2% | 25.5% |
| Mean | 14.3% | 11.6% |
| Median | 11.5% | 12.1% |
| Interquartile 25% (IQ1) | 10.5% | 8.3% |
| Interquartile 75% (IQ3) | 16.2% | 14.8% |
| Interquartile Range (IQR) | 5.7% | 6.5% |
| Standard Deviation (Sample) | 9.7% | 5.1% |
| Standard Deviation (Population) | 9.6% | 5.0% |
Similar Demographics by Male Poverty
Demographics Similar to Immigrants from Kenya by Male Poverty
In terms of male poverty, the demographic groups most similar to Immigrants from Kenya are Arab (11.6%, a difference of 0.050%), Hmong (11.6%, a difference of 0.050%), Delaware (11.7%, a difference of 0.12%), Immigrants from Kuwait (11.6%, a difference of 0.21%), and Iraqi (11.7%, a difference of 0.25%).
| Demographics | Rating | Rank | Male Poverty |
| Immigrants | Iraq | 31.9 /100 | #187 | Fair 11.4% |
| Sierra Leoneans | 29.9 /100 | #188 | Fair 11.4% |
| Hawaiians | 28.3 /100 | #189 | Fair 11.4% |
| Israelis | 26.1 /100 | #190 | Fair 11.5% |
| South American Indians | 22.8 /100 | #191 | Fair 11.5% |
| Immigrants | Uruguay | 19.1 /100 | #192 | Poor 11.6% |
| Immigrants | Kuwait | 17.3 /100 | #193 | Poor 11.6% |
| Immigrants | Kenya | 16.1 /100 | #194 | Poor 11.6% |
| Arabs | 15.8 /100 | #195 | Poor 11.6% |
| Hmong | 15.8 /100 | #196 | Poor 11.6% |
| Delaware | 15.4 /100 | #197 | Poor 11.7% |
| Iraqis | 14.7 /100 | #198 | Poor 11.7% |
| Spanish | 14.1 /100 | #199 | Poor 11.7% |
| Immigrants | Lebanon | 13.6 /100 | #200 | Poor 11.7% |
| Spaniards | 13.5 /100 | #201 | Poor 11.7% |
Demographics Similar to Ottawa by Male Poverty
In terms of male poverty, the demographic groups most similar to Ottawa are Trinidadian and Tobagonian (13.1%, a difference of 0.020%), Spanish American Indian (13.1%, a difference of 0.070%), Cherokee (13.1%, a difference of 0.11%), Cape Verdean (13.1%, a difference of 0.28%), and Immigrants from Trinidad and Tobago (13.1%, a difference of 0.40%).
| Demographics | Rating | Rank | Male Poverty |
| Immigrants | Ghana | 0.2 /100 | #253 | Tragic 12.9% |
| Mexican American Indians | 0.1 /100 | #254 | Tragic 13.0% |
| Immigrants | Liberia | 0.1 /100 | #255 | Tragic 13.0% |
| Immigrants | Burma/Myanmar | 0.1 /100 | #256 | Tragic 13.0% |
| Immigrants | Trinidad and Tobago | 0.1 /100 | #257 | Tragic 13.1% |
| Cape Verdeans | 0.1 /100 | #258 | Tragic 13.1% |
| Cherokee | 0.1 /100 | #259 | Tragic 13.1% |
| Ottawa | 0.1 /100 | #260 | Tragic 13.1% |
| Trinidadians and Tobagonians | 0.1 /100 | #261 | Tragic 13.1% |
| Spanish American Indians | 0.1 /100 | #262 | Tragic 13.1% |
| Central Americans | 0.1 /100 | #263 | Tragic 13.2% |
| Iroquois | 0.1 /100 | #264 | Tragic 13.2% |
| Jamaicans | 0.1 /100 | #265 | Tragic 13.2% |
| Immigrants | Guyana | 0.1 /100 | #266 | Tragic 13.2% |
| Immigrants | Jamaica | 0.1 /100 | #267 | Tragic 13.3% |