Immigrants from Kenya vs Immigrants from Grenada Seniors Poverty Over the Age of 75
COMPARE
Immigrants from Kenya
Immigrants from Grenada
Seniors Poverty Over the Age of 75
Seniors Poverty Over the Age of 75 Comparison
Immigrants from Kenya
Immigrants from Grenada
11.9%
SENIORS POVERTY OVER THE AGE OF 75
72.6/ 100
METRIC RATING
139th/ 347
METRIC RANK
17.8%
SENIORS POVERTY OVER THE AGE OF 75
0.0/ 100
METRIC RATING
334th/ 347
METRIC RANK
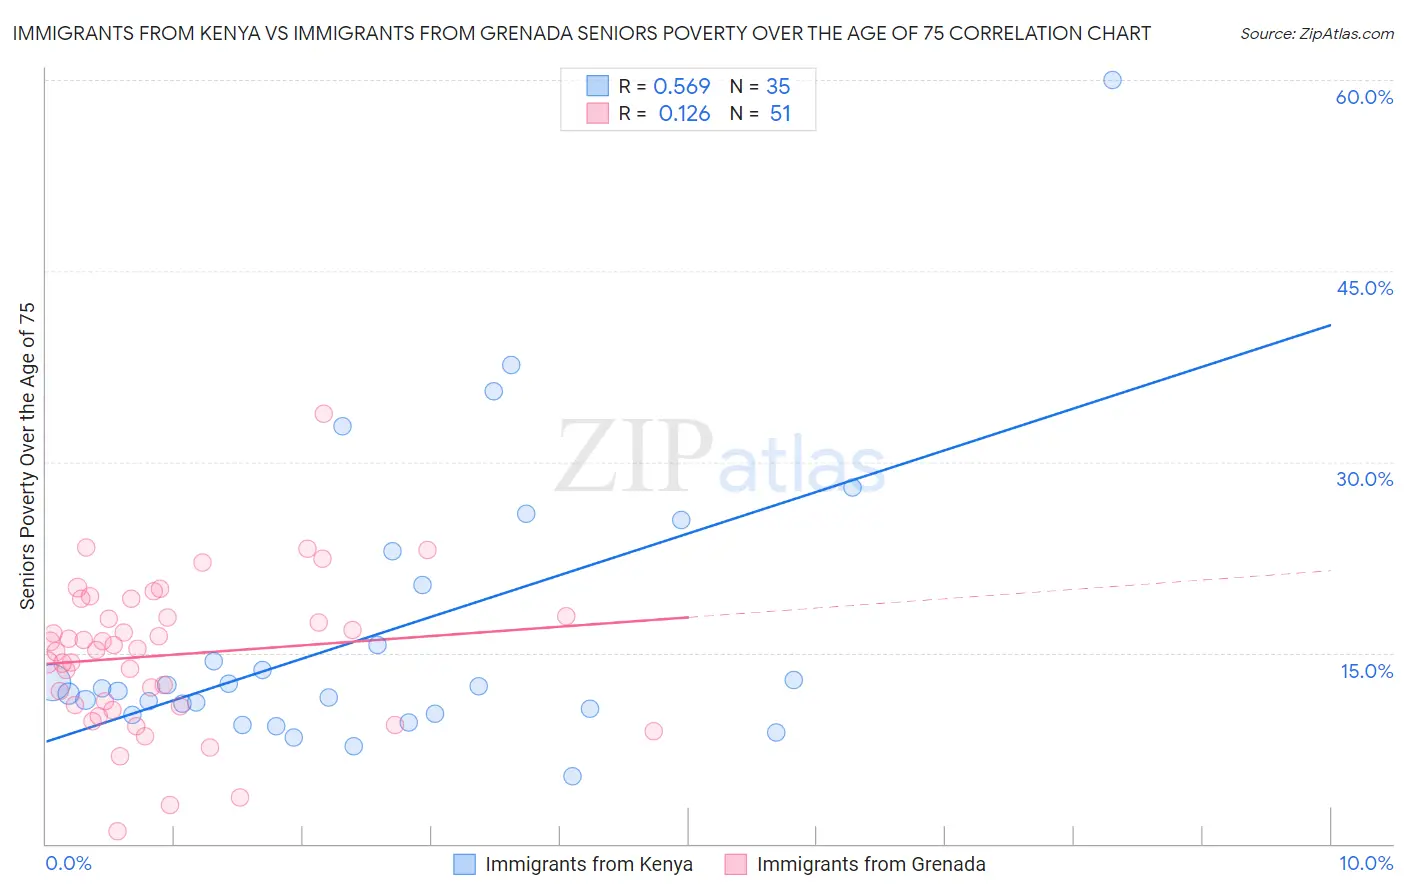
Immigrants from Kenya vs Immigrants from Grenada Seniors Poverty Over the Age of 75 Correlation Chart
The statistical analysis conducted on geographies consisting of 216,694,487 people shows a substantial positive correlation between the proportion of Immigrants from Kenya and poverty level among seniors over the age of 75 in the United States with a correlation coefficient (R) of 0.569 and weighted average of 11.9%. Similarly, the statistical analysis conducted on geographies consisting of 66,944,348 people shows a poor positive correlation between the proportion of Immigrants from Grenada and poverty level among seniors over the age of 75 in the United States with a correlation coefficient (R) of 0.126 and weighted average of 17.8%, a difference of 49.4%.
Seniors Poverty Over the Age of 75 Correlation Summary
| Measurement | Immigrants from Kenya | Immigrants from Grenada |
| Minimum | 5.3% | 0.99% |
| Maximum | 60.0% | 33.8% |
| Range | 54.7% | 32.8% |
| Mean | 16.5% | 14.8% |
| Median | 12.2% | 15.3% |
| Interquartile 25% (IQ1) | 10.2% | 10.8% |
| Interquartile 75% (IQ3) | 20.3% | 17.8% |
| Interquartile Range (IQR) | 10.1% | 7.0% |
| Standard Deviation (Sample) | 11.1% | 5.9% |
| Standard Deviation (Population) | 11.0% | 5.8% |
Similar Demographics by Seniors Poverty Over the Age of 75
Demographics Similar to Immigrants from Kenya by Seniors Poverty Over the Age of 75
In terms of seniors poverty over the age of 75, the demographic groups most similar to Immigrants from Kenya are Immigrants from Romania (11.9%, a difference of 0.010%), Immigrants from Pakistan (12.0%, a difference of 0.070%), Immigrants from Cameroon (12.0%, a difference of 0.080%), Immigrants from Laos (12.0%, a difference of 0.11%), and American (12.0%, a difference of 0.16%).
| Demographics | Rating | Rank | Seniors Poverty Over the Age of 75 |
| Lebanese | 78.3 /100 | #132 | Good 11.9% |
| Immigrants | Sierra Leone | 77.6 /100 | #133 | Good 11.9% |
| Ugandans | 77.1 /100 | #134 | Good 11.9% |
| Immigrants | Ireland | 76.2 /100 | #135 | Good 11.9% |
| Immigrants | Philippines | 75.0 /100 | #136 | Good 11.9% |
| Immigrants | Moldova | 74.1 /100 | #137 | Good 11.9% |
| Immigrants | Romania | 72.6 /100 | #138 | Good 11.9% |
| Immigrants | Kenya | 72.6 /100 | #139 | Good 11.9% |
| Immigrants | Pakistan | 71.9 /100 | #140 | Good 12.0% |
| Immigrants | Cameroon | 71.7 /100 | #141 | Good 12.0% |
| Immigrants | Laos | 71.5 /100 | #142 | Good 12.0% |
| Americans | 71.0 /100 | #143 | Good 12.0% |
| Hmong | 70.8 /100 | #144 | Good 12.0% |
| Immigrants | Belgium | 70.8 /100 | #145 | Good 12.0% |
| Bangladeshis | 70.4 /100 | #146 | Good 12.0% |
Demographics Similar to Immigrants from Grenada by Seniors Poverty Over the Age of 75
In terms of seniors poverty over the age of 75, the demographic groups most similar to Immigrants from Grenada are Cuban (18.0%, a difference of 0.59%), Immigrants from Nicaragua (17.6%, a difference of 1.5%), Immigrants from St. Vincent and the Grenadines (17.5%, a difference of 2.0%), Immigrants from Armenia (17.5%, a difference of 2.2%), and Immigrants from Caribbean (18.2%, a difference of 2.2%).
| Demographics | Rating | Rank | Seniors Poverty Over the Age of 75 |
| Sioux | 0.0 /100 | #327 | Tragic 16.8% |
| Cape Verdeans | 0.0 /100 | #328 | Tragic 16.8% |
| Immigrants | Dominica | 0.0 /100 | #329 | Tragic 17.0% |
| British West Indians | 0.0 /100 | #330 | Tragic 17.4% |
| Immigrants | Armenia | 0.0 /100 | #331 | Tragic 17.5% |
| Immigrants | St. Vincent and the Grenadines | 0.0 /100 | #332 | Tragic 17.5% |
| Immigrants | Nicaragua | 0.0 /100 | #333 | Tragic 17.6% |
| Immigrants | Grenada | 0.0 /100 | #334 | Tragic 17.8% |
| Cubans | 0.0 /100 | #335 | Tragic 18.0% |
| Immigrants | Caribbean | 0.0 /100 | #336 | Tragic 18.2% |
| Yakama | 0.0 /100 | #337 | Tragic 18.3% |
| Immigrants | Cabo Verde | 0.0 /100 | #338 | Tragic 18.5% |
| Hopi | 0.0 /100 | #339 | Tragic 18.9% |
| Tohono O'odham | 0.0 /100 | #340 | Tragic 19.1% |
| Navajo | 0.0 /100 | #341 | Tragic 19.4% |