Immigrants from Kenya vs Czech Seniors Poverty Over the Age of 65

COMPARE

Immigrants from Kenya
Race
Ancestry
AfghanAfricanAlaska NativeAlaskan AthabascanAlbanianAleutAlsatianAmericanApacheArabArapahoArgentineanArmenianAssyrian/Chaldean/SyriacAustralianAustrianBahamianBangladeshiBarbadianBasqueBelgianBelizeanBermudanBhutaneseBlackfeetBolivianBrazilianBritishBritish West IndianBulgarianBurmeseCajunCambodianCanadianCape VerdeanCarpatho RusynCelticCentral AmericanCentral American IndianCherokeeCheyenneChickasawChileanChineseChippewaChoctawColombianColvilleComancheCosta RicanCreeCreekCroatianCrowCubanCypriotCzechoslovakianDanishDelawareDominicanDutchDutch West IndianEastern EuropeanEcuadorianEgyptianEnglishEstonianEthiopianEuropeanFijianFilipinoFinnishFrenchFrench American IndianFrench CanadianGermanGerman RussianGhanaianGreekGuamanian/ChamorroGuatemalanGuyaneseHaitianHmongHonduranHopiHoumaHungarianIcelanderIndian (Asian)IndonesianInupiatIranianIraqiIrishIroquoisIsraeliItalianJamaicanJapaneseJordanianKenyanKiowaKoreanLaotianLatvianLebaneseLiberianLithuanianLumbeeLuxembourgerMacedonianMalaysianMalteseMarshalleseMenomineeMexicanMexican American IndianMongolianMoroccanNative HawaiianNavajoNepaleseNew ZealanderNicaraguanNigerianNorthern EuropeanNorwegianOkinawanOsageOttawaPaiutePakistaniPalestinianPanamanianParaguayanPennsylvania GermanPeruvianPimaPolishPortuguesePotawatomiPuebloPuerto RicanPuget Sound SalishRomanianRussianSalvadoranSamoanScandinavianScotch-IrishScottishSeminoleSenegaleseSerbianShoshoneSierra LeoneanSiouxSlavicSlovakSloveneSomaliSouth AfricanSouth AmericanSouth American IndianSoviet UnionSpaniardSpanishSpanish AmericanSpanish American IndianSri LankanSubsaharan AfricanSudaneseSwedishSwissSyrianTaiwaneseThaiTlingit-HaidaTohono O'OdhamTonganTrinidadian and TobagonianTsimshianTurkishU.S. Virgin IslanderUgandanUkrainianUruguayanUteVenezuelanVietnameseWelshWest IndianYakamaYaquiYugoslavianYumanYup'ikZimbabwean
Immigration
NonimmigrantsImmigrantsAfghanistanAfricaAlbaniaArgentinaArmeniaAsiaAustraliaAustriaBahamasBangladeshBarbadosBelarusBelgiumBelizeBoliviaBosnia and HerzegovinaBrazilBulgariaBurma/MyanmarCabo VerdeCambodiaCameroonCanadaCaribbeanCentral AmericaChileChinaColombiaCongoCosta RicaCroatiaCubaCzechoslovakiaDenmarkDominicaDominican RepublicEastern AfricaEastern AsiaEastern EuropeEcuadorEgyptEl SalvadorEnglandEritreaEthiopiaEuropeFijiFranceGermanyGhanaGreeceGrenadaGuatemalaGuyanaHaitiHondurasHong KongHungaryIndiaIndonesiaIranIraqIrelandIsraelItalyJamaicaJapanJordanKazakhstanKenyaKoreaKuwaitLaosLatin AmericaLatviaLebanonLiberiaLithuaniaMalaysiaMexicoMicronesiaMiddle AfricaMoldovaMoroccoNepalNetherlandsNicaraguaNigeriaNorth AmericaNorth MacedoniaNorthern AfricaNorthern EuropeNorwayOceaniaPakistanPanamaPeruPhilippinesPolandPortugalRomaniaRussiaSaudi ArabiaScotlandSenegalSerbiaSierra LeoneSingaporeSomaliaSouth AfricaSouth AmericaSouth Central AsiaSouth Eastern AsiaSouthern EuropeSpainSri LankaSt. Vincent and the GrenadinesSudanSwedenSwitzerlandSyriaTaiwanThailandTrinidad and TobagoTurkeyUgandaUkraineUruguayUzbekistanVenezuelaVietnamWest IndiesWestern AfricaWestern AsiaWestern EuropeYemenZaireZimbabweAzores
Czech
Race
Ancestry
AfghanAfricanAlaska NativeAlaskan AthabascanAlbanianAleutAlsatianAmericanApacheArabArapahoArgentineanArmenianAssyrian/Chaldean/SyriacAustralianAustrianBahamianBangladeshiBarbadianBasqueBelgianBelizeanBermudanBhutaneseBlackfeetBolivianBrazilianBritishBritish West IndianBulgarianBurmeseCajunCambodianCanadianCape VerdeanCarpatho RusynCelticCentral AmericanCentral American IndianCherokeeCheyenneChickasawChileanChineseChippewaChoctawColombianColvilleComancheCosta RicanCreeCreekCroatianCrowCubanCypriotCzechCzechoslovakianDanishDelawareDominicanDutchDutch West IndianEastern EuropeanEcuadorianEgyptianEnglishEstonianEthiopianEuropeanFijianFilipinoFinnishFrenchFrench American IndianFrench CanadianGermanGerman RussianGhanaianGreekGuamanian/ChamorroGuatemalanGuyaneseHaitianHmongHonduranHopiHoumaHungarianIcelanderIndian (Asian)IndonesianInupiatIranianIraqiIrishIroquoisIsraeliItalianJamaicanJapaneseJordanianKenyanKiowaKoreanLaotianLatvianLebaneseLiberianLithuanianLumbeeLuxembourgerMacedonianMalaysianMalteseMarshalleseMenomineeMexicanMexican American IndianMongolianMoroccanNative HawaiianNavajoNepaleseNew ZealanderNicaraguanNigerianNorthern EuropeanNorwegianOkinawanOsageOttawaPaiutePakistaniPalestinianPanamanianParaguayanPennsylvania GermanPeruvianPimaPolishPortuguesePotawatomiPuebloPuerto RicanPuget Sound SalishRomanianRussianSalvadoranSamoanScandinavianScotch-IrishScottishSeminoleSenegaleseSerbianShoshoneSierra LeoneanSiouxSlavicSlovakSloveneSomaliSouth AfricanSouth AmericanSouth American IndianSoviet UnionSpaniardSpanishSpanish AmericanSpanish American IndianSri LankanSubsaharan AfricanSudaneseSwedishSwissSyrianTaiwaneseThaiTlingit-HaidaTohono O'OdhamTonganTrinidadian and TobagonianTsimshianTurkishU.S. Virgin IslanderUgandanUkrainianUruguayanUteVenezuelanVietnameseWelshWest IndianYakamaYaquiYugoslavianYumanYup'ikZimbabwean
Immigration
NonimmigrantsImmigrantsAfghanistanAfricaAlbaniaArgentinaArmeniaAsiaAustraliaAustriaBahamasBangladeshBarbadosBelarusBelgiumBelizeBoliviaBosnia and HerzegovinaBrazilBulgariaBurma/MyanmarCabo VerdeCambodiaCameroonCanadaCaribbeanCentral AmericaChileChinaColombiaCongoCosta RicaCroatiaCubaCzechoslovakiaDenmarkDominicaDominican RepublicEastern AfricaEastern AsiaEastern EuropeEcuadorEgyptEl SalvadorEnglandEritreaEthiopiaEuropeFijiFranceGermanyGhanaGreeceGrenadaGuatemalaGuyanaHaitiHondurasHong KongHungaryIndiaIndonesiaIranIraqIrelandIsraelItalyJamaicaJapanJordanKazakhstanKoreaKuwaitLaosLatin AmericaLatviaLebanonLiberiaLithuaniaMalaysiaMexicoMicronesiaMiddle AfricaMoldovaMoroccoNepalNetherlandsNicaraguaNigeriaNorth AmericaNorth MacedoniaNorthern AfricaNorthern EuropeNorwayOceaniaPakistanPanamaPeruPhilippinesPolandPortugalRomaniaRussiaSaudi ArabiaScotlandSenegalSerbiaSierra LeoneSingaporeSomaliaSouth AfricaSouth AmericaSouth Central AsiaSouth Eastern AsiaSouthern EuropeSpainSri LankaSt. Vincent and the GrenadinesSudanSwedenSwitzerlandSyriaTaiwanThailandTrinidad and TobagoTurkeyUgandaUkraineUruguayUzbekistanVenezuelaVietnamWest IndiesWestern AfricaWestern AsiaWestern EuropeYemenZaireZimbabweAzores
Seniors Poverty Over the Age of 65
Income
Poverty
Unemployment
Labor Participation
Family Structure
Vehicle Availability
Education Level
Disability

Seniors Poverty Over the Age of 65 Comparison

Immigrants from Kenya

Czechs

Excellent
Exceptional
10.5%
SENIORS POVERTY OVER THE AGE OF 65
83.4/ 100
METRIC RATING
140th/ 347
METRIC RANK
9.0%
SENIORS POVERTY OVER THE AGE OF 65
100.0/ 100
METRIC RATING
8th/ 347
METRIC RANK

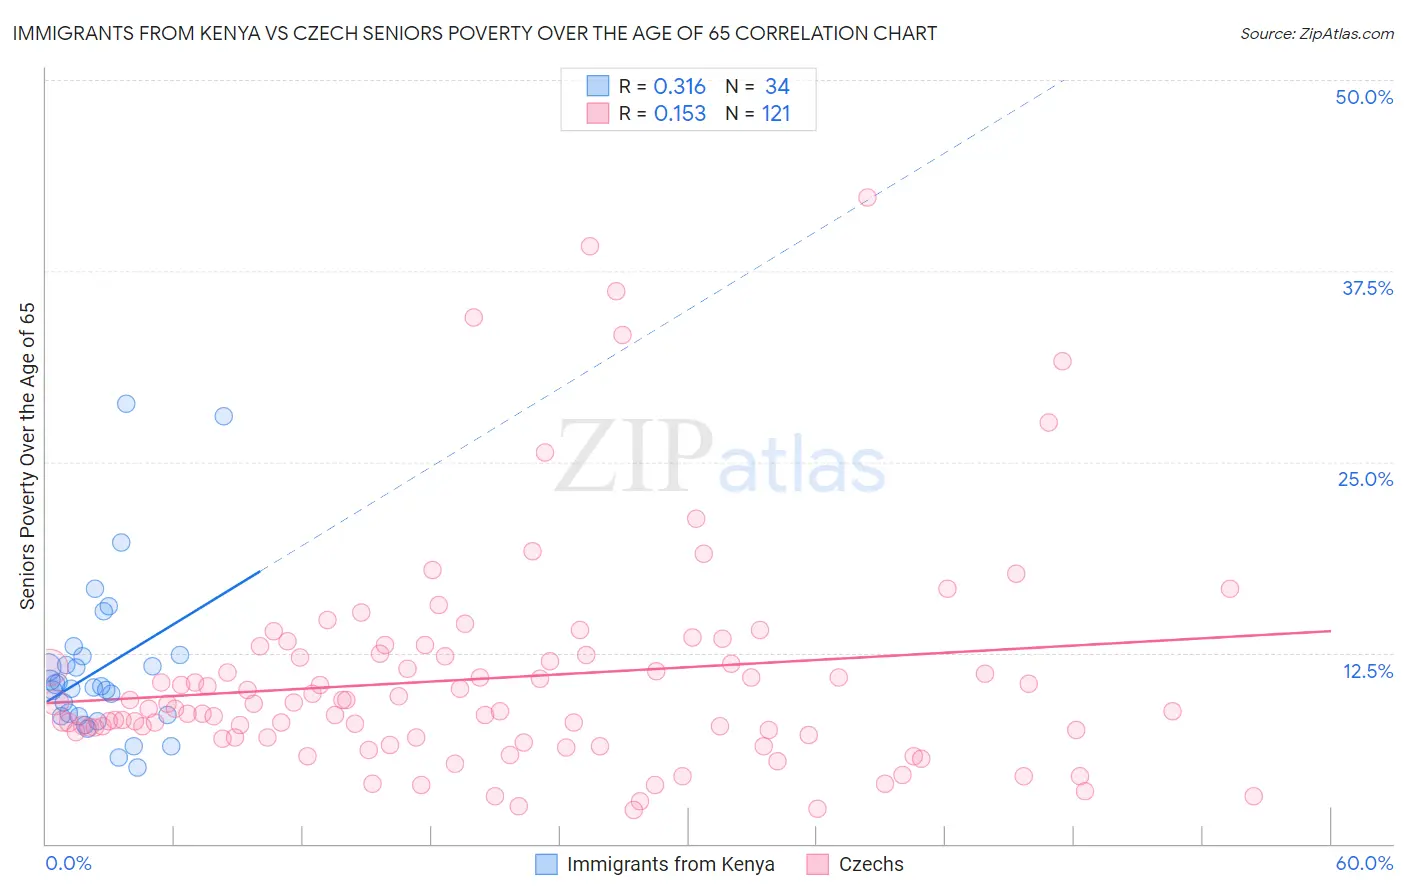
Immigrants from Kenya vs Czech Seniors Poverty Over the Age of 65 Correlation Chart

The statistical analysis conducted on geographies consisting of 217,579,819 people shows a mild positive correlation between the proportion of Immigrants from Kenya and poverty level among seniors over the age of 65 in the United States with a correlation coefficient (R) of 0.316 and weighted average of 10.5%. Similarly, the statistical analysis conducted on geographies consisting of 482,004,633 people shows a poor positive correlation between the proportion of Czechs and poverty level among seniors over the age of 65 in the United States with a correlation coefficient (R) of 0.153 and weighted average of 9.0%, a difference of 17.2%.
Immigrants from Kenya vs Czech Seniors Poverty Over the Age of 65

Seniors Poverty Over the Age of 65 Correlation Summary

MeasurementImmigrants from KenyaCzech
Minimum5.0%2.2%
Maximum28.8%42.3%
Range23.8%40.1%
Mean11.5%10.8%
Median10.3%8.9%
Interquartile 25% (IQ1)8.4%7.0%
Interquartile 75% (IQ3)12.3%12.3%
Interquartile Range (IQR)3.9%5.4%
Standard Deviation (Sample)5.3%7.3%
Standard Deviation (Population)5.2%7.3%

Similar Demographics by Seniors Poverty Over the Age of 65

Demographics Similar to Immigrants from Kenya by Seniors Poverty Over the Age of 65

In terms of seniors poverty over the age of 65, the demographic groups most similar to Immigrants from Kenya are Immigrants from Europe (10.5%, a difference of 0.020%), Osage (10.6%, a difference of 0.090%), Portuguese (10.5%, a difference of 0.13%), Immigrants from Latvia (10.5%, a difference of 0.23%), and Immigrants from Australia (10.5%, a difference of 0.29%).
DemographicsRating | RankSeniors Poverty Over the Age of 65
Guamanians/Chamorros
87.5
/100
|
#133
Excellent
10.5%
Sierra Leoneans
86.8
/100
|
#134
Excellent
10.5%
Immigrants | Norway
86.5
/100
|
#135
Excellent
10.5%
Immigrants | Serbia
86.4
/100
|
#136
Excellent
10.5%
Immigrants | Australia
85.1
/100
|
#137
Excellent
10.5%
Immigrants | Latvia
84.7
/100
|
#138
Excellent
10.5%
Portuguese
84.1
/100
|
#139
Excellent
10.5%
Immigrants | Kenya
83.4
/100
|
#140
Excellent
10.5%
Immigrants | Europe
83.3
/100
|
#141
Excellent
10.5%
Osage
82.8
/100
|
#142
Excellent
10.6%
Immigrants | Asia
80.8
/100
|
#143
Excellent
10.6%
Iraqis
80.7
/100
|
#144
Excellent
10.6%
Laotians
79.9
/100
|
#145
Good
10.6%
Alaskan Athabascans
79.1
/100
|
#146
Good
10.6%
Immigrants | Greece
79.0
/100
|
#147
Good
10.6%

Demographics Similar to Czechs by Seniors Poverty Over the Age of 65

In terms of seniors poverty over the age of 65, the demographic groups most similar to Czechs are German (9.0%, a difference of 0.53%), English (9.1%, a difference of 0.67%), Lithuanian (9.1%, a difference of 0.77%), Maltese (9.1%, a difference of 1.2%), and Scandinavian (9.1%, a difference of 1.4%).
DemographicsRating | RankSeniors Poverty Over the Age of 65
Chinese
100.0
/100
|
#1
Exceptional
8.3%
Tlingit-Haida
100.0
/100
|
#2
Exceptional
8.3%
Norwegians
100.0
/100
|
#3
Exceptional
8.7%
Swedes
100.0
/100
|
#4
Exceptional
8.7%
Immigrants | India
100.0
/100
|
#5
Exceptional
8.8%
Danes
100.0
/100
|
#6
Exceptional
8.8%
Germans
100.0
/100
|
#7
Exceptional
9.0%
Czechs
100.0
/100
|
#8
Exceptional
9.0%
English
100.0
/100
|
#9
Exceptional
9.1%
Lithuanians
100.0
/100
|
#10
Exceptional
9.1%
Maltese
99.9
/100
|
#11
Exceptional
9.1%
Scandinavians
99.9
/100
|
#12
Exceptional
9.1%
Croatians
99.9
/100
|
#13
Exceptional
9.1%
Poles
99.9
/100
|
#14
Exceptional
9.1%
Dutch
99.9
/100
|
#15
Exceptional
9.1%