Immigrants from Kazakhstan vs Dutch West Indian Female Poverty Among 18-24 Year Olds
COMPARE
Immigrants from Kazakhstan
Dutch West Indian
Female Poverty Among 18-24 Year Olds
Female Poverty Among 18-24 Year Olds Comparison
Immigrants from Kazakhstan
Dutch West Indians
20.2%
FEMALE POVERTY AMONG 18-24 YEAR OLDS
44.2/ 100
METRIC RATING
177th/ 347
METRIC RANK
24.5%
FEMALE POVERTY AMONG 18-24 YEAR OLDS
0.0/ 100
METRIC RATING
319th/ 347
METRIC RANK
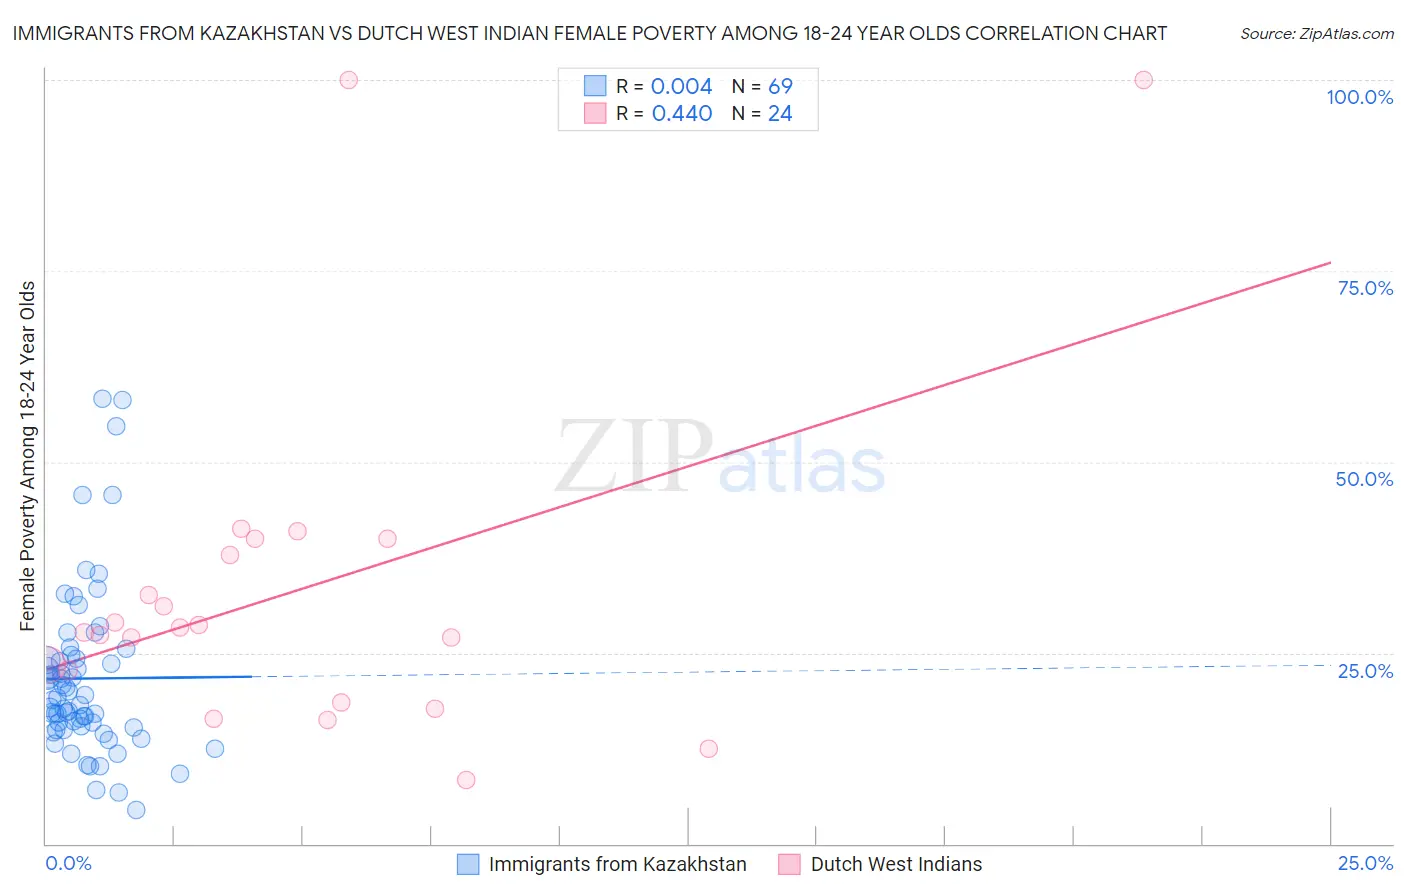
Immigrants from Kazakhstan vs Dutch West Indian Female Poverty Among 18-24 Year Olds Correlation Chart
The statistical analysis conducted on geographies consisting of 123,639,864 people shows no correlation between the proportion of Immigrants from Kazakhstan and poverty level among females between the ages 18 and 24 in the United States with a correlation coefficient (R) of 0.004 and weighted average of 20.2%. Similarly, the statistical analysis conducted on geographies consisting of 85,171,032 people shows a moderate positive correlation between the proportion of Dutch West Indians and poverty level among females between the ages 18 and 24 in the United States with a correlation coefficient (R) of 0.440 and weighted average of 24.5%, a difference of 21.5%.
Female Poverty Among 18-24 Year Olds Correlation Summary
| Measurement | Immigrants from Kazakhstan | Dutch West Indian |
| Minimum | 4.3% | 8.3% |
| Maximum | 58.3% | 100.0% |
| Range | 54.0% | 91.7% |
| Mean | 21.6% | 33.1% |
| Median | 18.9% | 28.0% |
| Interquartile 25% (IQ1) | 15.1% | 20.6% |
| Interquartile 75% (IQ3) | 24.5% | 38.9% |
| Interquartile Range (IQR) | 9.4% | 18.3% |
| Standard Deviation (Sample) | 11.1% | 22.5% |
| Standard Deviation (Population) | 11.0% | 22.0% |
Similar Demographics by Female Poverty Among 18-24 Year Olds
Demographics Similar to Immigrants from Kazakhstan by Female Poverty Among 18-24 Year Olds
In terms of female poverty among 18-24 year olds, the demographic groups most similar to Immigrants from Kazakhstan are Swiss (20.2%, a difference of 0.010%), Ethiopian (20.2%, a difference of 0.020%), Kenyan (20.2%, a difference of 0.040%), Iraqi (20.2%, a difference of 0.040%), and Immigrants from China (20.2%, a difference of 0.060%).
| Demographics | Rating | Rank | Female Poverty Among 18-24 Year Olds |
| Iranians | 54.7 /100 | #170 | Average 20.1% |
| Immigrants | Nigeria | 54.3 /100 | #171 | Average 20.1% |
| Belizeans | 52.0 /100 | #172 | Average 20.1% |
| Irish | 50.0 /100 | #173 | Average 20.1% |
| Swedes | 50.0 /100 | #174 | Average 20.1% |
| South American Indians | 48.4 /100 | #175 | Average 20.1% |
| Kenyans | 44.9 /100 | #176 | Average 20.2% |
| Immigrants | Kazakhstan | 44.2 /100 | #177 | Average 20.2% |
| Swiss | 44.0 /100 | #178 | Average 20.2% |
| Ethiopians | 43.8 /100 | #179 | Average 20.2% |
| Iraqis | 43.3 /100 | #180 | Average 20.2% |
| Immigrants | China | 43.0 /100 | #181 | Average 20.2% |
| Immigrants | Barbados | 42.8 /100 | #182 | Average 20.2% |
| Lebanese | 40.6 /100 | #183 | Average 20.2% |
| Immigrants | Central America | 39.9 /100 | #184 | Fair 20.2% |
Demographics Similar to Dutch West Indians by Female Poverty Among 18-24 Year Olds
In terms of female poverty among 18-24 year olds, the demographic groups most similar to Dutch West Indians are Chickasaw (24.5%, a difference of 0.10%), Osage (24.5%, a difference of 0.18%), Immigrants from Congo (24.6%, a difference of 0.30%), Alsatian (24.4%, a difference of 0.48%), and Black/African American (24.3%, a difference of 0.79%).
| Demographics | Rating | Rank | Female Poverty Among 18-24 Year Olds |
| Yuman | 0.0 /100 | #312 | Tragic 24.0% |
| Creek | 0.0 /100 | #313 | Tragic 24.2% |
| Choctaw | 0.0 /100 | #314 | Tragic 24.3% |
| Blacks/African Americans | 0.0 /100 | #315 | Tragic 24.3% |
| Alsatians | 0.0 /100 | #316 | Tragic 24.4% |
| Osage | 0.0 /100 | #317 | Tragic 24.5% |
| Chickasaw | 0.0 /100 | #318 | Tragic 24.5% |
| Dutch West Indians | 0.0 /100 | #319 | Tragic 24.5% |
| Immigrants | Congo | 0.0 /100 | #320 | Tragic 24.6% |
| Immigrants | Zaire | 0.0 /100 | #321 | Tragic 25.1% |
| Somalis | 0.0 /100 | #322 | Tragic 25.1% |
| Arapaho | 0.0 /100 | #323 | Tragic 25.2% |
| German Russians | 0.0 /100 | #324 | Tragic 25.2% |
| Immigrants | Saudi Arabia | 0.0 /100 | #325 | Tragic 25.3% |
| Yakama | 0.0 /100 | #326 | Tragic 25.3% |