Immigrants from Jordan vs Guamanian/Chamorro Child Poverty Among Girls Under 16
COMPARE
Immigrants from Jordan
Guamanian/Chamorro
Child Poverty Among Girls Under 16
Child Poverty Among Girls Under 16 Comparison
Immigrants from Jordan
Guamanians/Chamorros
15.6%
CHILD POVERTY AMONG GIRLS UNDER 16
87.2/ 100
METRIC RATING
141st/ 347
METRIC RANK
15.9%
CHILD POVERTY AMONG GIRLS UNDER 16
75.3/ 100
METRIC RATING
158th/ 347
METRIC RANK
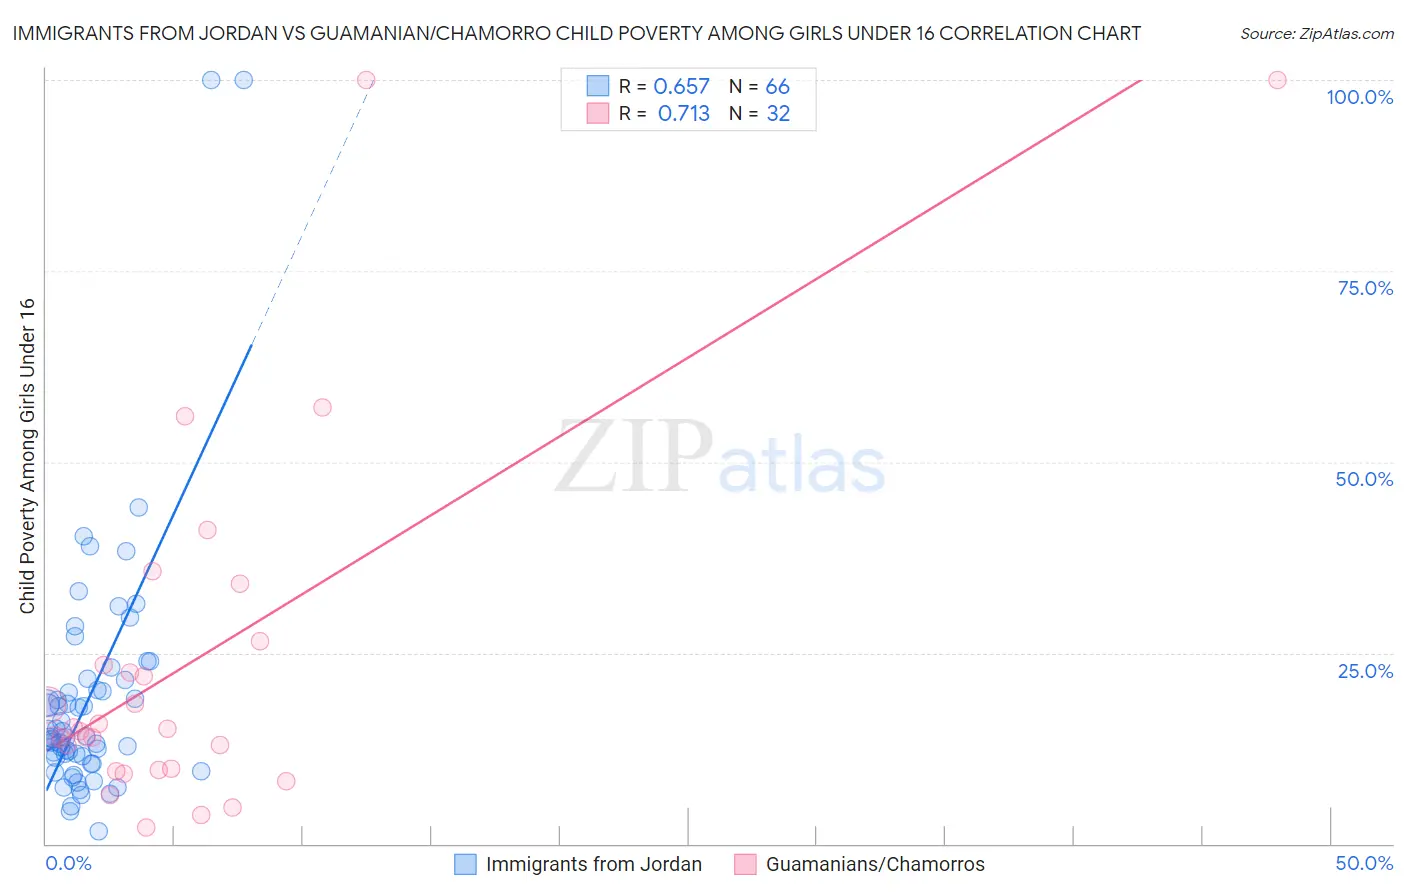
Immigrants from Jordan vs Guamanian/Chamorro Child Poverty Among Girls Under 16 Correlation Chart
The statistical analysis conducted on geographies consisting of 180,197,241 people shows a significant positive correlation between the proportion of Immigrants from Jordan and poverty level among girls under the age of 16 in the United States with a correlation coefficient (R) of 0.657 and weighted average of 15.6%. Similarly, the statistical analysis conducted on geographies consisting of 220,387,643 people shows a strong positive correlation between the proportion of Guamanians/Chamorros and poverty level among girls under the age of 16 in the United States with a correlation coefficient (R) of 0.713 and weighted average of 15.9%, a difference of 2.5%.
Child Poverty Among Girls Under 16 Correlation Summary
| Measurement | Immigrants from Jordan | Guamanian/Chamorro |
| Minimum | 1.6% | 2.0% |
| Maximum | 100.0% | 100.0% |
| Range | 98.4% | 98.0% |
| Mean | 19.3% | 23.8% |
| Median | 14.0% | 14.9% |
| Interquartile 25% (IQ1) | 11.4% | 9.7% |
| Interquartile 75% (IQ3) | 21.4% | 24.9% |
| Interquartile Range (IQR) | 10.0% | 15.2% |
| Standard Deviation (Sample) | 17.0% | 24.0% |
| Standard Deviation (Population) | 16.9% | 23.7% |
Demographics Similar to Immigrants from Jordan and Guamanians/Chamorros by Child Poverty Among Girls Under 16
In terms of child poverty among girls under 16, the demographic groups most similar to Immigrants from Jordan are New Zealander (15.6%, a difference of 0.010%), Canadian (15.6%, a difference of 0.020%), Immigrants from Peru (15.6%, a difference of 0.17%), Armenian (15.5%, a difference of 0.19%), and Israeli (15.6%, a difference of 0.26%). Similarly, the demographic groups most similar to Guamanians/Chamorros are Slovak (15.9%, a difference of 0.010%), Immigrants from Fiji (15.9%, a difference of 0.12%), Colombian (15.9%, a difference of 0.12%), Syrian (15.9%, a difference of 0.22%), and Immigrants from Chile (15.9%, a difference of 0.23%).
| Demographics | Rating | Rank | Child Poverty Among Girls Under 16 |
| Armenians | 87.9 /100 | #139 | Excellent 15.5% |
| New Zealanders | 87.2 /100 | #140 | Excellent 15.6% |
| Immigrants | Jordan | 87.2 /100 | #141 | Excellent 15.6% |
| Canadians | 87.1 /100 | #142 | Excellent 15.6% |
| Immigrants | Peru | 86.6 /100 | #143 | Excellent 15.6% |
| Israelis | 86.3 /100 | #144 | Excellent 15.6% |
| Welsh | 85.4 /100 | #145 | Excellent 15.6% |
| Samoans | 84.2 /100 | #146 | Excellent 15.7% |
| Slavs | 83.1 /100 | #147 | Excellent 15.7% |
| Icelanders | 82.4 /100 | #148 | Excellent 15.7% |
| Immigrants | Hungary | 80.9 /100 | #149 | Excellent 15.8% |
| Immigrants | Albania | 80.7 /100 | #150 | Excellent 15.8% |
| Venezuelans | 80.1 /100 | #151 | Excellent 15.8% |
| Immigrants | Kuwait | 79.4 /100 | #152 | Good 15.8% |
| Immigrants | Nepal | 78.5 /100 | #153 | Good 15.9% |
| Immigrants | Chile | 76.7 /100 | #154 | Good 15.9% |
| Syrians | 76.7 /100 | #155 | Good 15.9% |
| Immigrants | Fiji | 76.1 /100 | #156 | Good 15.9% |
| Colombians | 76.1 /100 | #157 | Good 15.9% |
| Guamanians/Chamorros | 75.3 /100 | #158 | Good 15.9% |
| Slovaks | 75.2 /100 | #159 | Good 15.9% |