Immigrants from Jordan vs Danish Single Father Poverty

COMPARE

Immigrants from Jordan
Race
Ancestry
AfghanAfricanAlaska NativeAlaskan AthabascanAlbanianAleutAlsatianAmericanApacheArabArapahoArgentineanArmenianAssyrian/Chaldean/SyriacAustralianAustrianBahamianBangladeshiBarbadianBasqueBelgianBelizeanBermudanBhutaneseBlackfeetBolivianBrazilianBritishBritish West IndianBulgarianBurmeseCajunCambodianCanadianCape VerdeanCarpatho RusynCelticCentral AmericanCentral American IndianCherokeeCheyenneChickasawChileanChineseChippewaChoctawColombianColvilleComancheCosta RicanCreeCreekCroatianCrowCubanCypriotCzechCzechoslovakianDelawareDominicanDutchDutch West IndianEastern EuropeanEcuadorianEgyptianEnglishEstonianEthiopianEuropeanFijianFilipinoFinnishFrenchFrench American IndianFrench CanadianGermanGerman RussianGhanaianGreekGuamanian/ChamorroGuatemalanGuyaneseHaitianHmongHonduranHopiHoumaHungarianIcelanderIndian (Asian)IndonesianInupiatIranianIraqiIrishIroquoisIsraeliItalianJamaicanJapaneseJordanianKenyanKiowaKoreanLaotianLatvianLebaneseLiberianLithuanianLumbeeLuxembourgerMacedonianMalaysianMalteseMarshalleseMenomineeMexicanMexican American IndianMongolianMoroccanNative HawaiianNavajoNepaleseNew ZealanderNicaraguanNigerianNorthern EuropeanNorwegianOkinawanOsageOttawaPaiutePakistaniPalestinianPanamanianParaguayanPennsylvania GermanPeruvianPimaPolishPortuguesePotawatomiPuebloPuerto RicanPuget Sound SalishRomanianRussianSalvadoranSamoanScandinavianScotch-IrishScottishSeminoleSenegaleseSerbianShoshoneSierra LeoneanSiouxSlavicSlovakSloveneSomaliSouth AfricanSouth AmericanSouth American IndianSoviet UnionSpaniardSpanishSpanish AmericanSpanish American IndianSri LankanSubsaharan AfricanSudaneseSwedishSwissSyrianTaiwaneseThaiTlingit-HaidaTohono O'OdhamTonganTrinidadian and TobagonianTsimshianTurkishU.S. Virgin IslanderUgandanUkrainianUruguayanUteVenezuelanVietnameseWelshWest IndianYakamaYaquiYugoslavianYumanYup'ikZimbabwean
Immigration
NonimmigrantsImmigrantsAfghanistanAfricaAlbaniaArgentinaArmeniaAsiaAustraliaAustriaBahamasBangladeshBarbadosBelarusBelgiumBelizeBoliviaBosnia and HerzegovinaBrazilBulgariaBurma/MyanmarCabo VerdeCambodiaCameroonCanadaCaribbeanCentral AmericaChileChinaColombiaCongoCosta RicaCroatiaCubaCzechoslovakiaDenmarkDominicaDominican RepublicEastern AfricaEastern AsiaEastern EuropeEcuadorEgyptEl SalvadorEnglandEritreaEthiopiaEuropeFijiFranceGermanyGhanaGreeceGrenadaGuatemalaGuyanaHaitiHondurasHong KongHungaryIndiaIndonesiaIranIraqIrelandIsraelItalyJamaicaJapanJordanKazakhstanKenyaKoreaKuwaitLaosLatin AmericaLatviaLebanonLiberiaLithuaniaMalaysiaMexicoMicronesiaMiddle AfricaMoldovaMoroccoNepalNetherlandsNicaraguaNigeriaNorth AmericaNorth MacedoniaNorthern AfricaNorthern EuropeNorwayOceaniaPakistanPanamaPeruPhilippinesPolandPortugalRomaniaRussiaSaudi ArabiaScotlandSenegalSerbiaSierra LeoneSingaporeSomaliaSouth AfricaSouth AmericaSouth Central AsiaSouth Eastern AsiaSouthern EuropeSpainSri LankaSt. Vincent and the GrenadinesSudanSwedenSwitzerlandSyriaTaiwanThailandTrinidad and TobagoTurkeyUgandaUkraineUruguayUzbekistanVenezuelaVietnamWest IndiesWestern AfricaWestern AsiaWestern EuropeYemenZaireZimbabweAzores
Danish
Race
Ancestry
AfghanAfricanAlaska NativeAlaskan AthabascanAlbanianAleutAlsatianAmericanApacheArabArapahoArgentineanArmenianAssyrian/Chaldean/SyriacAustralianAustrianBahamianBangladeshiBarbadianBasqueBelgianBelizeanBermudanBhutaneseBlackfeetBolivianBrazilianBritishBritish West IndianBulgarianBurmeseCajunCambodianCanadianCape VerdeanCarpatho RusynCelticCentral AmericanCentral American IndianCherokeeCheyenneChickasawChileanChineseChippewaChoctawColombianColvilleComancheCosta RicanCreeCreekCroatianCrowCubanCypriotCzechCzechoslovakianDanishDelawareDominicanDutchDutch West IndianEastern EuropeanEcuadorianEgyptianEnglishEstonianEthiopianEuropeanFijianFilipinoFinnishFrenchFrench American IndianFrench CanadianGermanGerman RussianGhanaianGreekGuamanian/ChamorroGuatemalanGuyaneseHaitianHmongHonduranHopiHoumaHungarianIcelanderIndian (Asian)IndonesianInupiatIranianIraqiIrishIroquoisIsraeliItalianJamaicanJapaneseJordanianKenyanKiowaKoreanLaotianLatvianLebaneseLiberianLithuanianLumbeeLuxembourgerMacedonianMalaysianMalteseMarshalleseMenomineeMexicanMexican American IndianMongolianMoroccanNative HawaiianNavajoNepaleseNew ZealanderNicaraguanNigerianNorthern EuropeanNorwegianOkinawanOsageOttawaPaiutePakistaniPalestinianPanamanianParaguayanPennsylvania GermanPeruvianPimaPolishPortuguesePotawatomiPuebloPuerto RicanPuget Sound SalishRomanianRussianSalvadoranSamoanScandinavianScotch-IrishScottishSeminoleSenegaleseSerbianShoshoneSierra LeoneanSiouxSlavicSlovakSloveneSomaliSouth AfricanSouth AmericanSouth American IndianSoviet UnionSpaniardSpanishSpanish AmericanSpanish American IndianSri LankanSubsaharan AfricanSudaneseSwedishSwissSyrianTaiwaneseThaiTlingit-HaidaTohono O'OdhamTonganTrinidadian and TobagonianTsimshianTurkishU.S. Virgin IslanderUgandanUkrainianUruguayanUteVenezuelanVietnameseWelshWest IndianYakamaYaquiYugoslavianYumanYup'ikZimbabwean
Immigration
NonimmigrantsImmigrantsAfghanistanAfricaAlbaniaArgentinaArmeniaAsiaAustraliaAustriaBahamasBangladeshBarbadosBelarusBelgiumBelizeBoliviaBosnia and HerzegovinaBrazilBulgariaBurma/MyanmarCabo VerdeCambodiaCameroonCanadaCaribbeanCentral AmericaChileChinaColombiaCongoCosta RicaCroatiaCubaCzechoslovakiaDenmarkDominicaDominican RepublicEastern AfricaEastern AsiaEastern EuropeEcuadorEgyptEl SalvadorEnglandEritreaEthiopiaEuropeFijiFranceGermanyGhanaGreeceGrenadaGuatemalaGuyanaHaitiHondurasHong KongHungaryIndiaIndonesiaIranIraqIrelandIsraelItalyJamaicaJapanKazakhstanKenyaKoreaKuwaitLaosLatin AmericaLatviaLebanonLiberiaLithuaniaMalaysiaMexicoMicronesiaMiddle AfricaMoldovaMoroccoNepalNetherlandsNicaraguaNigeriaNorth AmericaNorth MacedoniaNorthern AfricaNorthern EuropeNorwayOceaniaPakistanPanamaPeruPhilippinesPolandPortugalRomaniaRussiaSaudi ArabiaScotlandSenegalSerbiaSierra LeoneSingaporeSomaliaSouth AfricaSouth AmericaSouth Central AsiaSouth Eastern AsiaSouthern EuropeSpainSri LankaSt. Vincent and the GrenadinesSudanSwedenSwitzerlandSyriaTaiwanThailandTrinidad and TobagoTurkeyUgandaUkraineUruguayUzbekistanVenezuelaVietnamWest IndiesWestern AfricaWestern AsiaWestern EuropeYemenZaireZimbabweAzores
Single Father Poverty
Income
Poverty
Unemployment
Labor Participation
Family Structure
Vehicle Availability
Education Level
Disability

Single Father Poverty Comparison

Immigrants from Jordan

Danes

Good
Exceptional
16.2%
SINGLE FATHER POVERTY
66.0/ 100
METRIC RATING
156th/ 347
METRIC RANK
15.8%
SINGLE FATHER POVERTY
94.5/ 100
METRIC RATING
113th/ 347
METRIC RANK

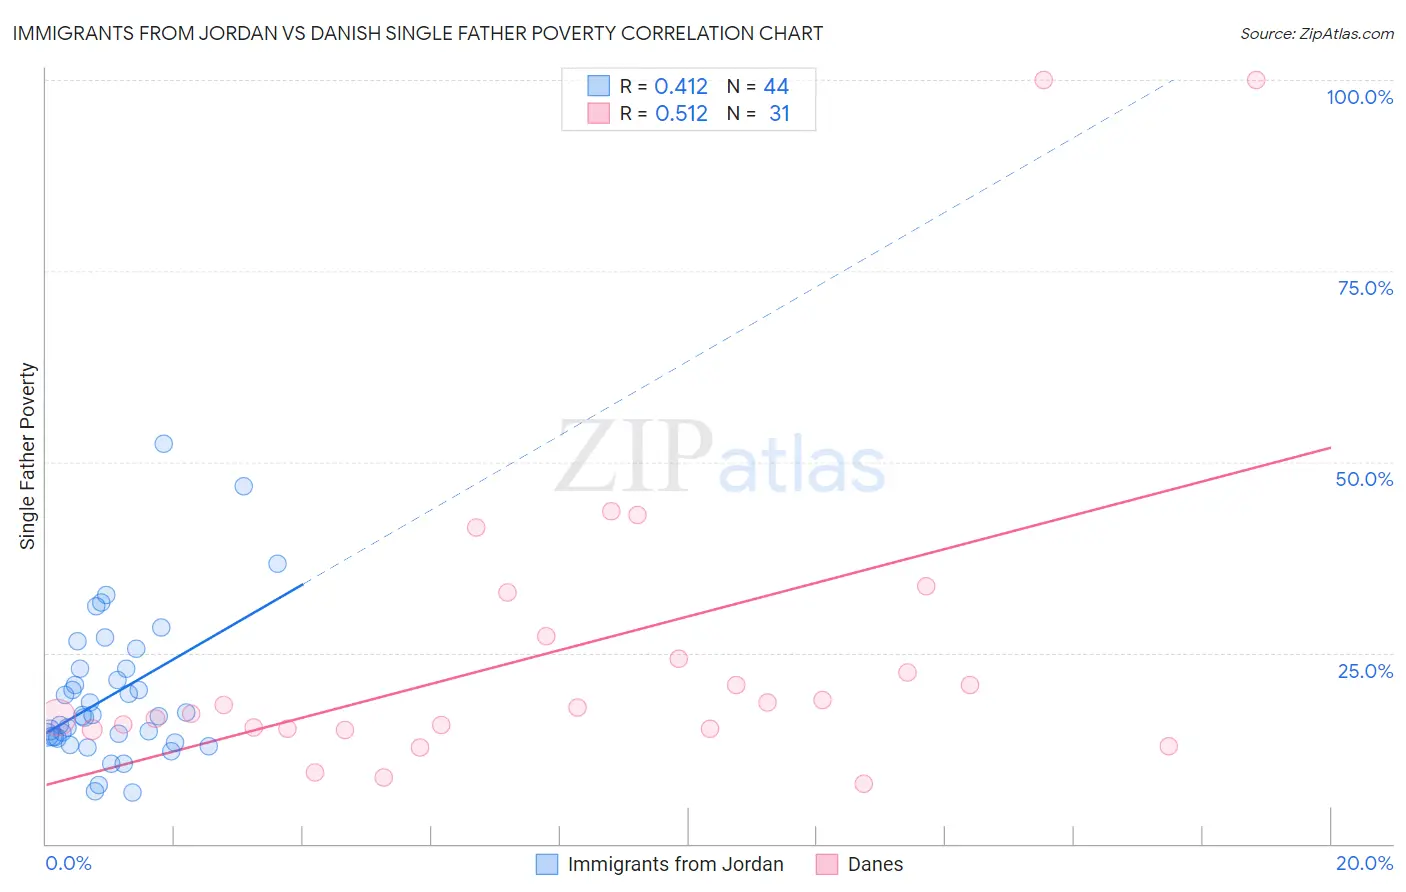
Immigrants from Jordan vs Danish Single Father Poverty Correlation Chart

The statistical analysis conducted on geographies consisting of 156,428,071 people shows a moderate positive correlation between the proportion of Immigrants from Jordan and poverty level among single fathers in the United States with a correlation coefficient (R) of 0.412 and weighted average of 16.2%. Similarly, the statistical analysis conducted on geographies consisting of 352,960,899 people shows a substantial positive correlation between the proportion of Danes and poverty level among single fathers in the United States with a correlation coefficient (R) of 0.512 and weighted average of 15.8%, a difference of 2.5%.
Immigrants from Jordan vs Danish Single Father Poverty

Single Father Poverty Correlation Summary

MeasurementImmigrants from JordanDanish
Minimum6.7%7.9%
Maximum52.4%100.0%
Range45.8%92.1%
Mean19.5%25.5%
Median16.7%17.9%
Interquartile 25% (IQ1)13.9%15.1%
Interquartile 75% (IQ3)22.9%27.1%
Interquartile Range (IQR)8.9%12.0%
Standard Deviation (Sample)9.6%22.0%
Standard Deviation (Population)9.5%21.6%

Similar Demographics by Single Father Poverty

Demographics Similar to Immigrants from Jordan by Single Father Poverty

In terms of single father poverty, the demographic groups most similar to Immigrants from Jordan are Immigrants from Nicaragua (16.2%, a difference of 0.090%), Immigrants from Czechoslovakia (16.2%, a difference of 0.16%), Portuguese (16.2%, a difference of 0.18%), Mexican (16.1%, a difference of 0.21%), and Belizean (16.2%, a difference of 0.29%).
DemographicsRating | RankSingle Father Poverty
South Africans
75.1
/100
|
#149
Good
16.1%
Jordanians
74.2
/100
|
#150
Good
16.1%
Immigrants | France
73.1
/100
|
#151
Good
16.1%
Immigrants | Zimbabwe
72.1
/100
|
#152
Good
16.1%
Immigrants | Israel
72.0
/100
|
#153
Good
16.1%
Mexicans
70.1
/100
|
#154
Good
16.1%
Immigrants | Nicaragua
67.8
/100
|
#155
Good
16.2%
Immigrants | Jordan
66.0
/100
|
#156
Good
16.2%
Immigrants | Czechoslovakia
62.8
/100
|
#157
Good
16.2%
Portuguese
62.3
/100
|
#158
Good
16.2%
Belizeans
59.9
/100
|
#159
Average
16.2%
Immigrants | Sudan
59.8
/100
|
#160
Average
16.2%
Estonians
56.7
/100
|
#161
Average
16.2%
Ugandans
55.9
/100
|
#162
Average
16.3%
Immigrants | Costa Rica
55.7
/100
|
#163
Average
16.3%

Demographics Similar to Danes by Single Father Poverty

In terms of single father poverty, the demographic groups most similar to Danes are Argentinean (15.8%, a difference of 0.020%), Immigrants from Latvia (15.8%, a difference of 0.040%), Bulgarian (15.8%, a difference of 0.080%), Immigrants from Africa (15.8%, a difference of 0.13%), and Turkish (15.8%, a difference of 0.14%).
DemographicsRating | RankSingle Father Poverty
Immigrants | Poland
95.8
/100
|
#106
Exceptional
15.7%
Native Hawaiians
95.8
/100
|
#107
Exceptional
15.7%
Pakistanis
95.7
/100
|
#108
Exceptional
15.7%
Turks
95.1
/100
|
#109
Exceptional
15.8%
Immigrants | Africa
95.1
/100
|
#110
Exceptional
15.8%
Bulgarians
94.8
/100
|
#111
Exceptional
15.8%
Immigrants | Latvia
94.7
/100
|
#112
Exceptional
15.8%
Danes
94.5
/100
|
#113
Exceptional
15.8%
Argentineans
94.4
/100
|
#114
Exceptional
15.8%
Immigrants | Thailand
93.6
/100
|
#115
Exceptional
15.8%
Immigrants | Argentina
92.8
/100
|
#116
Exceptional
15.8%
Immigrants | Colombia
92.6
/100
|
#117
Exceptional
15.8%
Immigrants | Eastern Europe
92.5
/100
|
#118
Exceptional
15.8%
Immigrants | Belarus
92.4
/100
|
#119
Exceptional
15.8%
Uruguayans
92.1
/100
|
#120
Exceptional
15.9%