Immigrants from Jordan vs Chippewa Poverty

COMPARE

Immigrants from Jordan
Race
Ancestry
AfghanAfricanAlaska NativeAlaskan AthabascanAlbanianAleutAlsatianAmericanApacheArabArapahoArgentineanArmenianAssyrian/Chaldean/SyriacAustralianAustrianBahamianBangladeshiBarbadianBasqueBelgianBelizeanBermudanBhutaneseBlackfeetBolivianBrazilianBritishBritish West IndianBulgarianBurmeseCajunCambodianCanadianCape VerdeanCarpatho RusynCelticCentral AmericanCentral American IndianCherokeeCheyenneChickasawChileanChineseChoctawColombianColvilleComancheCosta RicanCreeCreekCroatianCrowCubanCypriotCzechCzechoslovakianDanishDelawareDominicanDutchDutch West IndianEastern EuropeanEcuadorianEgyptianEnglishEstonianEthiopianEuropeanFijianFilipinoFinnishFrenchFrench American IndianFrench CanadianGermanGerman RussianGhanaianGreekGuamanian/ChamorroGuatemalanGuyaneseHaitianHmongHonduranHopiHoumaHungarianIcelanderIndian (Asian)IndonesianInupiatIranianIraqiIrishIroquoisIsraeliItalianJamaicanJapaneseJordanianKenyanKiowaKoreanLaotianLatvianLebaneseLiberianLithuanianLumbeeLuxembourgerMacedonianMalaysianMalteseMarshalleseMenomineeMexicanMexican American IndianMongolianMoroccanNative HawaiianNavajoNepaleseNew ZealanderNicaraguanNigerianNorthern EuropeanNorwegianOkinawanOsageOttawaPaiutePakistaniPalestinianPanamanianParaguayanPennsylvania GermanPeruvianPimaPolishPortuguesePotawatomiPuebloPuerto RicanPuget Sound SalishRomanianRussianSalvadoranSamoanScandinavianScotch-IrishScottishSeminoleSenegaleseSerbianShoshoneSierra LeoneanSiouxSlavicSlovakSloveneSomaliSouth AfricanSouth AmericanSouth American IndianSoviet UnionSpaniardSpanishSpanish AmericanSpanish American IndianSri LankanSubsaharan AfricanSudaneseSwedishSwissSyrianTaiwaneseThaiTlingit-HaidaTohono O'OdhamTonganTrinidadian and TobagonianTsimshianTurkishU.S. Virgin IslanderUgandanUkrainianUruguayanUteVenezuelanVietnameseWelshWest IndianYakamaYaquiYugoslavianYumanYup'ikZimbabwean
Immigration
NonimmigrantsImmigrantsAfghanistanAfricaAlbaniaArgentinaArmeniaAsiaAustraliaAustriaBahamasBangladeshBarbadosBelarusBelgiumBelizeBoliviaBosnia and HerzegovinaBrazilBulgariaBurma/MyanmarCabo VerdeCambodiaCameroonCanadaCaribbeanCentral AmericaChileChinaColombiaCongoCosta RicaCroatiaCubaCzechoslovakiaDenmarkDominicaDominican RepublicEastern AfricaEastern AsiaEastern EuropeEcuadorEgyptEl SalvadorEnglandEritreaEthiopiaEuropeFijiFranceGermanyGhanaGreeceGrenadaGuatemalaGuyanaHaitiHondurasHong KongHungaryIndiaIndonesiaIranIraqIrelandIsraelItalyJamaicaJapanJordanKazakhstanKenyaKoreaKuwaitLaosLatin AmericaLatviaLebanonLiberiaLithuaniaMalaysiaMexicoMicronesiaMiddle AfricaMoldovaMoroccoNepalNetherlandsNicaraguaNigeriaNorth AmericaNorth MacedoniaNorthern AfricaNorthern EuropeNorwayOceaniaPakistanPanamaPeruPhilippinesPolandPortugalRomaniaRussiaSaudi ArabiaScotlandSenegalSerbiaSierra LeoneSingaporeSomaliaSouth AfricaSouth AmericaSouth Central AsiaSouth Eastern AsiaSouthern EuropeSpainSri LankaSt. Vincent and the GrenadinesSudanSwedenSwitzerlandSyriaTaiwanThailandTrinidad and TobagoTurkeyUgandaUkraineUruguayUzbekistanVenezuelaVietnamWest IndiesWestern AfricaWestern AsiaWestern EuropeYemenZaireZimbabweAzores
Chippewa
Race
Ancestry
AfghanAfricanAlaska NativeAlaskan AthabascanAlbanianAleutAlsatianAmericanApacheArabArapahoArgentineanArmenianAssyrian/Chaldean/SyriacAustralianAustrianBahamianBangladeshiBarbadianBasqueBelgianBelizeanBermudanBhutaneseBlackfeetBolivianBrazilianBritishBritish West IndianBulgarianBurmeseCajunCambodianCanadianCape VerdeanCarpatho RusynCelticCentral AmericanCentral American IndianCherokeeCheyenneChickasawChileanChineseChippewaChoctawColombianColvilleComancheCosta RicanCreeCreekCroatianCrowCubanCypriotCzechCzechoslovakianDanishDelawareDominicanDutchDutch West IndianEastern EuropeanEcuadorianEgyptianEnglishEstonianEthiopianEuropeanFijianFilipinoFinnishFrenchFrench American IndianFrench CanadianGermanGerman RussianGhanaianGreekGuamanian/ChamorroGuatemalanGuyaneseHaitianHmongHonduranHopiHoumaHungarianIcelanderIndian (Asian)IndonesianInupiatIranianIraqiIrishIroquoisIsraeliItalianJamaicanJapaneseJordanianKenyanKiowaKoreanLaotianLatvianLebaneseLiberianLithuanianLumbeeLuxembourgerMacedonianMalaysianMalteseMarshalleseMenomineeMexicanMexican American IndianMongolianMoroccanNative HawaiianNavajoNepaleseNew ZealanderNicaraguanNigerianNorthern EuropeanNorwegianOkinawanOsageOttawaPaiutePakistaniPalestinianPanamanianParaguayanPennsylvania GermanPeruvianPimaPolishPortuguesePotawatomiPuebloPuerto RicanPuget Sound SalishRomanianRussianSalvadoranSamoanScandinavianScotch-IrishScottishSeminoleSenegaleseSerbianShoshoneSierra LeoneanSiouxSlavicSlovakSloveneSomaliSouth AfricanSouth AmericanSouth American IndianSoviet UnionSpaniardSpanishSpanish AmericanSpanish American IndianSri LankanSubsaharan AfricanSudaneseSwedishSwissSyrianTaiwaneseThaiTlingit-HaidaTohono O'OdhamTonganTrinidadian and TobagonianTsimshianTurkishU.S. Virgin IslanderUgandanUkrainianUruguayanUteVenezuelanVietnameseWelshWest IndianYakamaYaquiYugoslavianYumanYup'ikZimbabwean
Immigration
NonimmigrantsImmigrantsAfghanistanAfricaAlbaniaArgentinaArmeniaAsiaAustraliaAustriaBahamasBangladeshBarbadosBelarusBelgiumBelizeBoliviaBosnia and HerzegovinaBrazilBulgariaBurma/MyanmarCabo VerdeCambodiaCameroonCanadaCaribbeanCentral AmericaChileChinaColombiaCongoCosta RicaCroatiaCubaCzechoslovakiaDenmarkDominicaDominican RepublicEastern AfricaEastern AsiaEastern EuropeEcuadorEgyptEl SalvadorEnglandEritreaEthiopiaEuropeFijiFranceGermanyGhanaGreeceGrenadaGuatemalaGuyanaHaitiHondurasHong KongHungaryIndiaIndonesiaIranIraqIrelandIsraelItalyJamaicaJapanKazakhstanKenyaKoreaKuwaitLaosLatin AmericaLatviaLebanonLiberiaLithuaniaMalaysiaMexicoMicronesiaMiddle AfricaMoldovaMoroccoNepalNetherlandsNicaraguaNigeriaNorth AmericaNorth MacedoniaNorthern AfricaNorthern EuropeNorwayOceaniaPakistanPanamaPeruPhilippinesPolandPortugalRomaniaRussiaSaudi ArabiaScotlandSenegalSerbiaSierra LeoneSingaporeSomaliaSouth AfricaSouth AmericaSouth Central AsiaSouth Eastern AsiaSouthern EuropeSpainSri LankaSt. Vincent and the GrenadinesSudanSwedenSwitzerlandSyriaTaiwanThailandTrinidad and TobagoTurkeyUgandaUkraineUruguayUzbekistanVenezuelaVietnamWest IndiesWestern AfricaWestern AsiaWestern EuropeYemenZaireZimbabweAzores
Poverty
Income
Poverty
Unemployment
Labor Participation
Family Structure
Vehicle Availability
Education Level
Disability

Poverty Comparison

Immigrants from Jordan

Chippewa

Excellent
Tragic
11.9%
POVERTY
82.4/ 100
METRIC RATING
138th/ 347
METRIC RANK
15.7%
POVERTY
0.0/ 100
METRIC RATING
311th/ 347
METRIC RANK

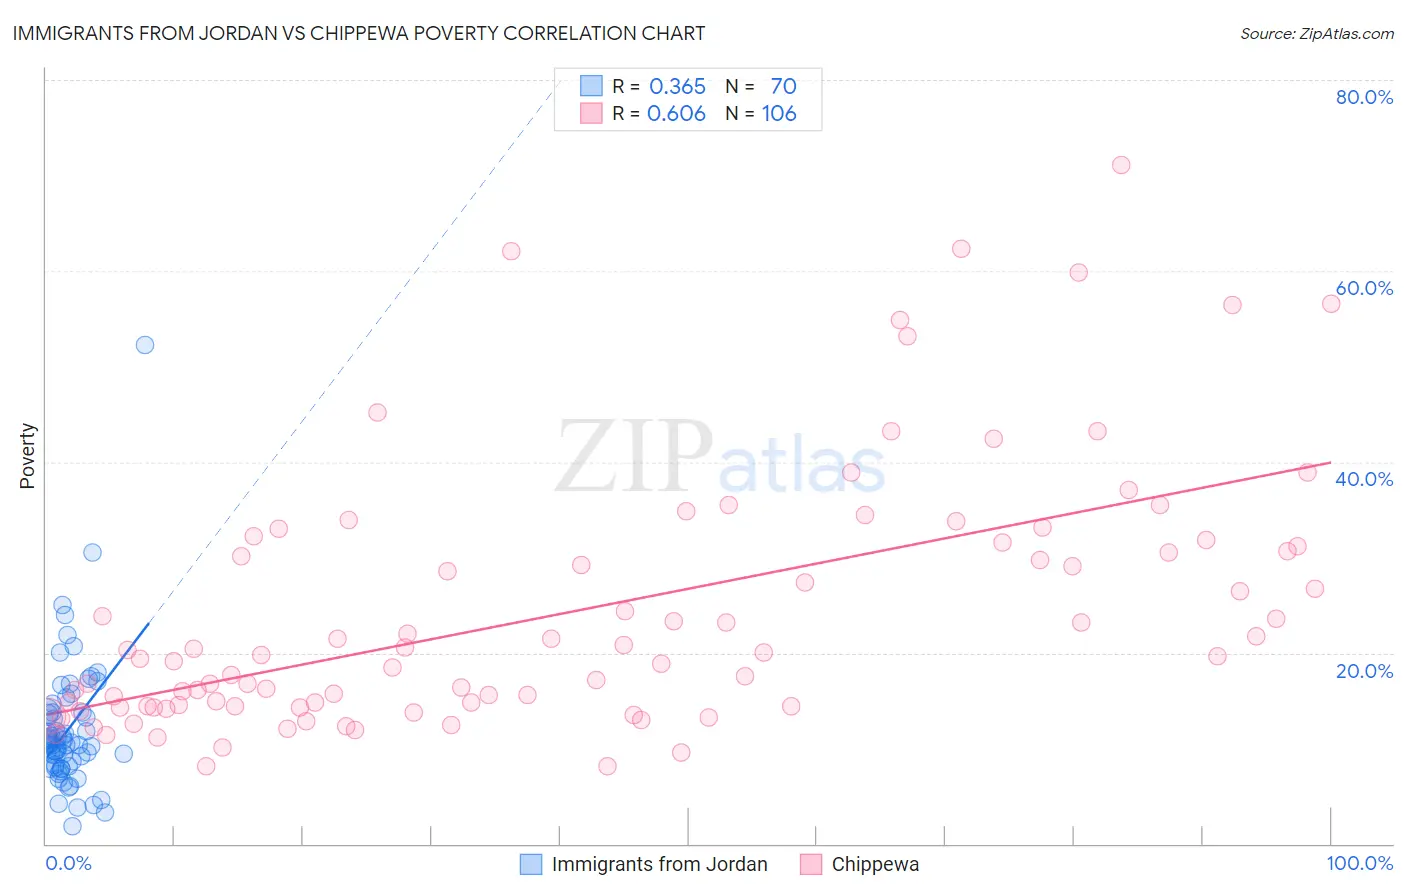
Immigrants from Jordan vs Chippewa Poverty Correlation Chart

The statistical analysis conducted on geographies consisting of 181,257,123 people shows a mild positive correlation between the proportion of Immigrants from Jordan and poverty level in the United States with a correlation coefficient (R) of 0.365 and weighted average of 11.9%. Similarly, the statistical analysis conducted on geographies consisting of 215,014,776 people shows a significant positive correlation between the proportion of Chippewa and poverty level in the United States with a correlation coefficient (R) of 0.606 and weighted average of 15.7%, a difference of 32.3%.
Immigrants from Jordan vs Chippewa Poverty

Poverty Correlation Summary

MeasurementImmigrants from JordanChippewa
Minimum1.8%8.1%
Maximum52.2%71.1%
Range50.4%63.0%
Mean12.0%24.2%
Median10.5%19.7%
Interquartile 25% (IQ1)8.1%14.4%
Interquartile 75% (IQ3)13.8%31.1%
Interquartile Range (IQR)5.6%16.7%
Standard Deviation (Sample)7.2%13.5%
Standard Deviation (Population)7.1%13.4%

Similar Demographics by Poverty

Demographics Similar to Immigrants from Jordan by Poverty

In terms of poverty, the demographic groups most similar to Immigrants from Jordan are Pakistani (11.9%, a difference of 0.030%), Immigrants from Switzerland (11.8%, a difference of 0.11%), Immigrants from Peru (11.9%, a difference of 0.22%), Immigrants from France (11.9%, a difference of 0.31%), and Chilean (11.8%, a difference of 0.32%).
DemographicsRating | RankPoverty
French
86.1
/100
|
#131
Excellent
11.8%
Peruvians
85.6
/100
|
#132
Excellent
11.8%
Immigrants | Western Europe
85.2
/100
|
#133
Excellent
11.8%
Yugoslavians
85.2
/100
|
#134
Excellent
11.8%
Immigrants | Vietnam
85.2
/100
|
#135
Excellent
11.8%
Chileans
84.2
/100
|
#136
Excellent
11.8%
Immigrants | Switzerland
83.0
/100
|
#137
Excellent
11.8%
Immigrants | Jordan
82.4
/100
|
#138
Excellent
11.9%
Pakistanis
82.2
/100
|
#139
Excellent
11.9%
Immigrants | Peru
81.1
/100
|
#140
Excellent
11.9%
Immigrants | France
80.5
/100
|
#141
Excellent
11.9%
Basques
80.4
/100
|
#142
Excellent
11.9%
Brazilians
79.7
/100
|
#143
Good
11.9%
Icelanders
77.9
/100
|
#144
Good
11.9%
Syrians
75.1
/100
|
#145
Good
12.0%

Demographics Similar to Chippewa by Poverty

In terms of poverty, the demographic groups most similar to Chippewa are Cajun (15.7%, a difference of 0.16%), Dutch West Indian (15.6%, a difference of 0.39%), Seminole (15.6%, a difference of 0.48%), Choctaw (15.6%, a difference of 0.52%), and Immigrants from Grenada (15.8%, a difference of 0.60%).
DemographicsRating | RankPoverty
Immigrants | Mexico
0.0
/100
|
#304
Tragic
15.5%
Immigrants | Guatemala
0.0
/100
|
#305
Tragic
15.5%
Creek
0.0
/100
|
#306
Tragic
15.6%
Africans
0.0
/100
|
#307
Tragic
15.6%
Choctaw
0.0
/100
|
#308
Tragic
15.6%
Seminole
0.0
/100
|
#309
Tragic
15.6%
Dutch West Indians
0.0
/100
|
#310
Tragic
15.6%
Chippewa
0.0
/100
|
#311
Tragic
15.7%
Cajuns
0.0
/100
|
#312
Tragic
15.7%
Immigrants | Grenada
0.0
/100
|
#313
Tragic
15.8%
Immigrants | Somalia
0.0
/100
|
#314
Tragic
15.8%
British West Indians
0.0
/100
|
#315
Tragic
15.9%
Hondurans
0.0
/100
|
#316
Tragic
15.9%
U.S. Virgin Islanders
0.0
/100
|
#317
Tragic
16.1%
Immigrants | Dominica
0.0
/100
|
#318
Tragic
16.1%