Immigrants from Japan vs Paiute Family Poverty
COMPARE
Immigrants from Japan
Paiute
Family Poverty
Family Poverty Comparison
Immigrants from Japan
Paiute
7.4%
FAMILY POVERTY
99.5/ 100
METRIC RATING
33rd/ 347
METRIC RANK
13.0%
FAMILY POVERTY
0.0/ 100
METRIC RATING
325th/ 347
METRIC RANK
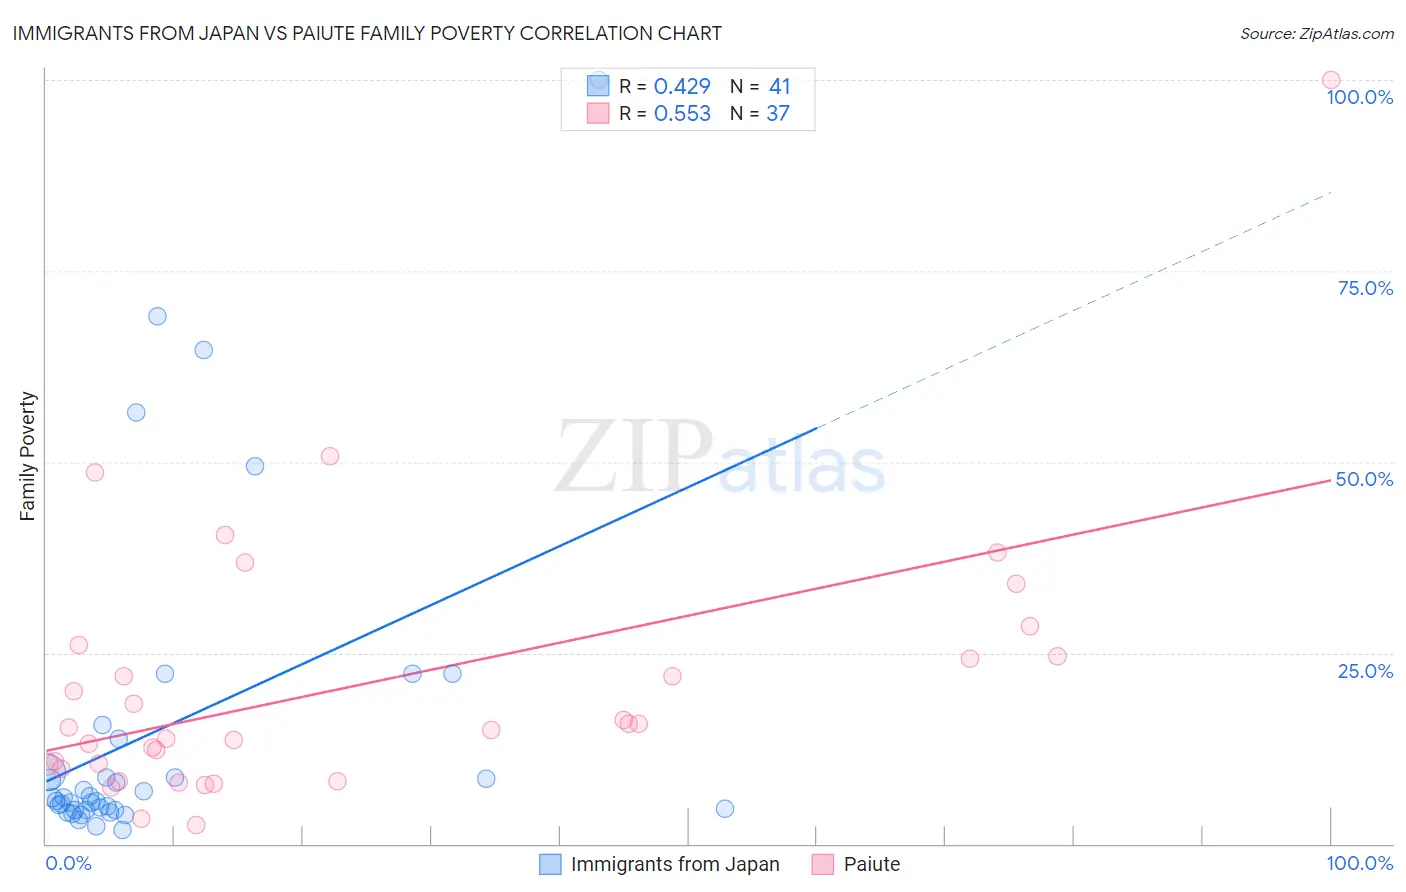
Immigrants from Japan vs Paiute Family Poverty Correlation Chart
The statistical analysis conducted on geographies consisting of 339,424,982 people shows a moderate positive correlation between the proportion of Immigrants from Japan and poverty level among families in the United States with a correlation coefficient (R) of 0.429 and weighted average of 7.4%. Similarly, the statistical analysis conducted on geographies consisting of 58,372,907 people shows a substantial positive correlation between the proportion of Paiute and poverty level among families in the United States with a correlation coefficient (R) of 0.553 and weighted average of 13.0%, a difference of 74.7%.
Family Poverty Correlation Summary
| Measurement | Immigrants from Japan | Paiute |
| Minimum | 1.7% | 2.4% |
| Maximum | 100.0% | 100.0% |
| Range | 98.3% | 97.6% |
| Mean | 14.8% | 20.9% |
| Median | 6.1% | 15.2% |
| Interquartile 25% (IQ1) | 4.4% | 10.1% |
| Interquartile 75% (IQ3) | 11.6% | 25.3% |
| Interquartile Range (IQR) | 7.1% | 15.2% |
| Standard Deviation (Sample) | 21.6% | 18.0% |
| Standard Deviation (Population) | 21.3% | 17.8% |
Similar Demographics by Family Poverty
Demographics Similar to Immigrants from Japan by Family Poverty
In terms of family poverty, the demographic groups most similar to Immigrants from Japan are Polish (7.4%, a difference of 0.0%), Russian (7.5%, a difference of 0.23%), Czech (7.4%, a difference of 0.30%), Italian (7.4%, a difference of 0.42%), and Immigrants from Northern Europe (7.4%, a difference of 0.71%).
| Demographics | Rating | Rank | Family Poverty |
| Cypriots | 99.6 /100 | #26 | Exceptional 7.3% |
| Immigrants | Scotland | 99.6 /100 | #27 | Exceptional 7.3% |
| Immigrants | Korea | 99.6 /100 | #28 | Exceptional 7.4% |
| Immigrants | Northern Europe | 99.6 /100 | #29 | Exceptional 7.4% |
| Italians | 99.6 /100 | #30 | Exceptional 7.4% |
| Czechs | 99.6 /100 | #31 | Exceptional 7.4% |
| Poles | 99.5 /100 | #32 | Exceptional 7.4% |
| Immigrants | Japan | 99.5 /100 | #33 | Exceptional 7.4% |
| Russians | 99.5 /100 | #34 | Exceptional 7.5% |
| Greeks | 99.4 /100 | #35 | Exceptional 7.5% |
| Turks | 99.4 /100 | #36 | Exceptional 7.5% |
| Estonians | 99.4 /100 | #37 | Exceptional 7.5% |
| Bolivians | 99.3 /100 | #38 | Exceptional 7.5% |
| Carpatho Rusyns | 99.3 /100 | #39 | Exceptional 7.5% |
| Slovenes | 99.3 /100 | #40 | Exceptional 7.5% |
Demographics Similar to Paiute by Family Poverty
In terms of family poverty, the demographic groups most similar to Paiute are Colville (13.0%, a difference of 0.060%), Yakama (13.1%, a difference of 0.75%), Immigrants from Dominica (12.7%, a difference of 2.0%), Menominee (12.7%, a difference of 2.0%), and Central American Indian (13.3%, a difference of 2.4%).
| Demographics | Rating | Rank | Family Poverty |
| U.S. Virgin Islanders | 0.0 /100 | #318 | Tragic 12.4% |
| British West Indians | 0.0 /100 | #319 | Tragic 12.4% |
| Inupiat | 0.0 /100 | #320 | Tragic 12.5% |
| Arapaho | 0.0 /100 | #321 | Tragic 12.7% |
| Immigrants | Honduras | 0.0 /100 | #322 | Tragic 12.7% |
| Menominee | 0.0 /100 | #323 | Tragic 12.7% |
| Immigrants | Dominica | 0.0 /100 | #324 | Tragic 12.7% |
| Paiute | 0.0 /100 | #325 | Tragic 13.0% |
| Colville | 0.0 /100 | #326 | Tragic 13.0% |
| Yakama | 0.0 /100 | #327 | Tragic 13.1% |
| Central American Indians | 0.0 /100 | #328 | Tragic 13.3% |
| Blacks/African Americans | 0.0 /100 | #329 | Tragic 13.3% |
| Natives/Alaskans | 0.0 /100 | #330 | Tragic 14.3% |
| Cheyenne | 0.0 /100 | #331 | Tragic 14.3% |
| Dominicans | 0.0 /100 | #332 | Tragic 14.3% |