Immigrants from Japan vs Immigrants from Taiwan Child Poverty Under the Age of 16
COMPARE
Immigrants from Japan
Immigrants from Taiwan
Child Poverty Under the Age of 16
Child Poverty Under the Age of 16 Comparison
Immigrants from Japan
Immigrants from Taiwan
13.0%
CHILD POVERTY UNDER THE AGE OF 16
99.8/ 100
METRIC RATING
19th/ 347
METRIC RANK
11.0%
CHILD POVERTY UNDER THE AGE OF 16
100.0/ 100
METRIC RATING
2nd/ 347
METRIC RANK
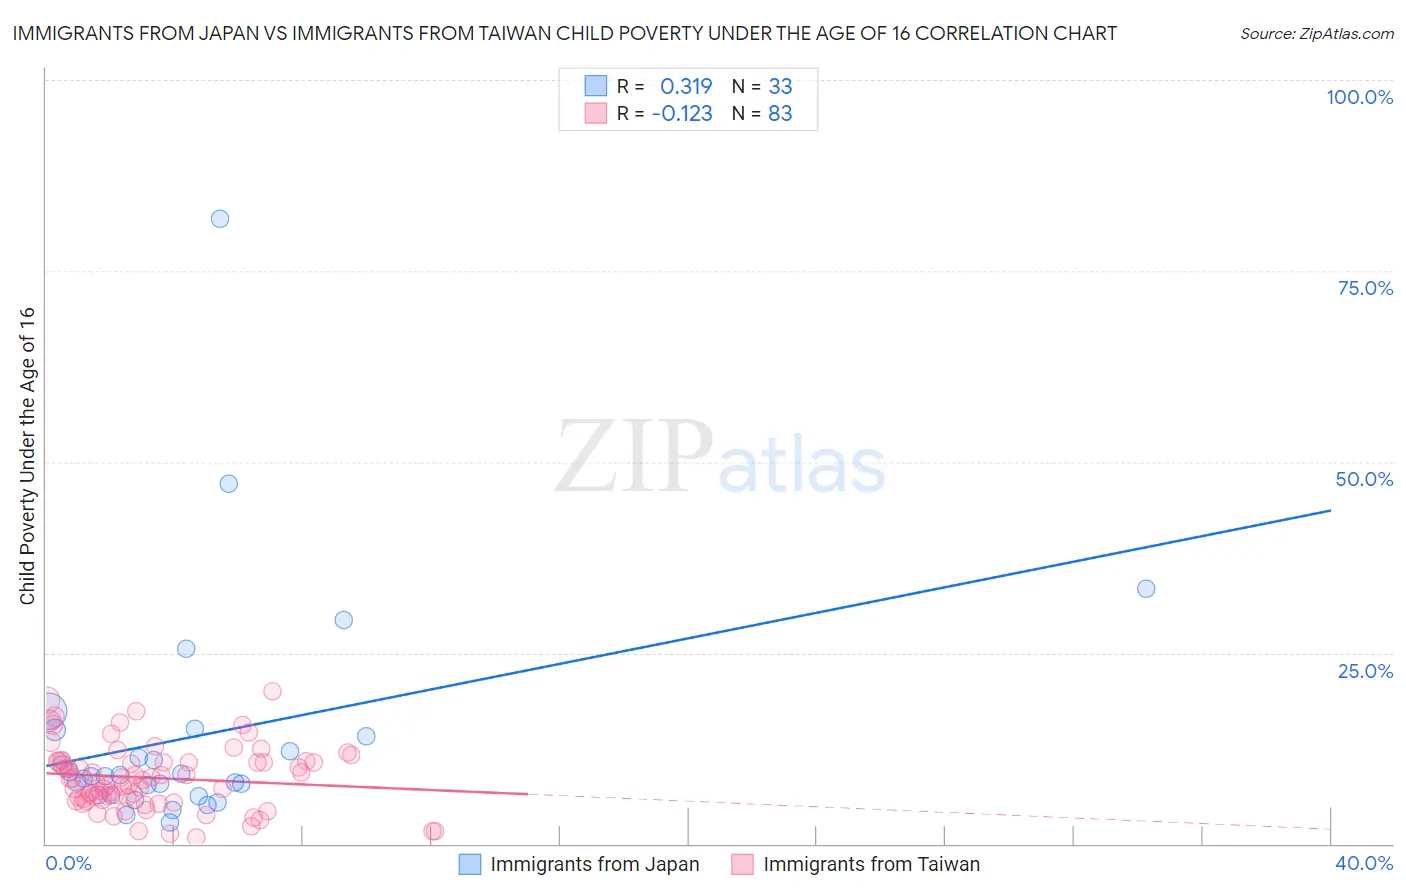
Immigrants from Japan vs Immigrants from Taiwan Child Poverty Under the Age of 16 Correlation Chart
The statistical analysis conducted on geographies consisting of 337,592,497 people shows a mild positive correlation between the proportion of Immigrants from Japan and poverty level among children under the age of 16 in the United States with a correlation coefficient (R) of 0.319 and weighted average of 13.0%. Similarly, the statistical analysis conducted on geographies consisting of 295,758,075 people shows a poor negative correlation between the proportion of Immigrants from Taiwan and poverty level among children under the age of 16 in the United States with a correlation coefficient (R) of -0.123 and weighted average of 11.0%, a difference of 18.2%.
Child Poverty Under the Age of 16 Correlation Summary
| Measurement | Immigrants from Japan | Immigrants from Taiwan |
| Minimum | 2.9% | 0.75% |
| Maximum | 81.8% | 20.0% |
| Range | 79.0% | 19.3% |
| Mean | 14.0% | 8.6% |
| Median | 8.9% | 8.5% |
| Interquartile 25% (IQ1) | 6.4% | 5.7% |
| Interquartile 75% (IQ3) | 14.5% | 10.8% |
| Interquartile Range (IQR) | 8.1% | 5.1% |
| Standard Deviation (Sample) | 15.4% | 4.2% |
| Standard Deviation (Population) | 15.1% | 4.2% |
Demographics Similar to Immigrants from Japan and Immigrants from Taiwan by Child Poverty Under the Age of 16
In terms of child poverty under the age of 16, the demographic groups most similar to Immigrants from Japan are Cypriot (13.0%, a difference of 0.030%), Bulgarian (13.0%, a difference of 0.45%), Okinawan (13.1%, a difference of 0.59%), Norwegian (13.0%, a difference of 0.68%), and Immigrants from Korea (13.0%, a difference of 0.73%). Similarly, the demographic groups most similar to Immigrants from Taiwan are Filipino (11.1%, a difference of 0.85%), Immigrants from India (10.8%, a difference of 2.5%), Thai (11.6%, a difference of 4.8%), Chinese (11.9%, a difference of 8.0%), and Immigrants from Hong Kong (12.1%, a difference of 10.0%).
| Demographics | Rating | Rank | Child Poverty Under the Age of 16 |
| Immigrants | India | 100.0 /100 | #1 | Exceptional 10.8% |
| Immigrants | Taiwan | 100.0 /100 | #2 | Exceptional 11.0% |
| Filipinos | 100.0 /100 | #3 | Exceptional 11.1% |
| Thais | 100.0 /100 | #4 | Exceptional 11.6% |
| Chinese | 100.0 /100 | #5 | Exceptional 11.9% |
| Immigrants | Hong Kong | 100.0 /100 | #6 | Exceptional 12.1% |
| Iranians | 100.0 /100 | #7 | Exceptional 12.2% |
| Immigrants | Singapore | 100.0 /100 | #8 | Exceptional 12.4% |
| Immigrants | Iran | 100.0 /100 | #9 | Exceptional 12.4% |
| Immigrants | South Central Asia | 99.9 /100 | #10 | Exceptional 12.5% |
| Bhutanese | 99.9 /100 | #11 | Exceptional 12.5% |
| Immigrants | Ireland | 99.9 /100 | #12 | Exceptional 12.7% |
| Burmese | 99.9 /100 | #13 | Exceptional 12.8% |
| Immigrants | Lithuania | 99.9 /100 | #14 | Exceptional 12.9% |
| Immigrants | Korea | 99.9 /100 | #15 | Exceptional 13.0% |
| Norwegians | 99.9 /100 | #16 | Exceptional 13.0% |
| Bulgarians | 99.9 /100 | #17 | Exceptional 13.0% |
| Cypriots | 99.9 /100 | #18 | Exceptional 13.0% |
| Immigrants | Japan | 99.8 /100 | #19 | Exceptional 13.0% |
| Okinawans | 99.8 /100 | #20 | Exceptional 13.1% |