Immigrants from Jamaica vs Laotian Child Poverty Among Boys Under 16

COMPARE

Immigrants from Jamaica
Race
Ancestry
AfghanAfricanAlaska NativeAlaskan AthabascanAlbanianAleutAlsatianAmericanApacheArabArapahoArgentineanArmenianAssyrian/Chaldean/SyriacAustralianAustrianBahamianBangladeshiBarbadianBasqueBelgianBelizeanBermudanBhutaneseBlackfeetBolivianBrazilianBritishBritish West IndianBulgarianBurmeseCajunCambodianCanadianCape VerdeanCarpatho RusynCelticCentral AmericanCentral American IndianCherokeeCheyenneChickasawChileanChineseChippewaChoctawColombianColvilleComancheCosta RicanCreeCreekCroatianCrowCubanCypriotCzechCzechoslovakianDanishDelawareDominicanDutchDutch West IndianEastern EuropeanEcuadorianEgyptianEnglishEstonianEthiopianEuropeanFijianFilipinoFinnishFrenchFrench American IndianFrench CanadianGermanGerman RussianGhanaianGreekGuamanian/ChamorroGuatemalanGuyaneseHaitianHmongHonduranHopiHoumaHungarianIcelanderIndian (Asian)IndonesianInupiatIranianIraqiIrishIroquoisIsraeliItalianJamaicanJapaneseJordanianKenyanKiowaKoreanLatvianLebaneseLiberianLithuanianLumbeeLuxembourgerMacedonianMalaysianMalteseMarshalleseMenomineeMexicanMexican American IndianMongolianMoroccanNative HawaiianNavajoNepaleseNew ZealanderNicaraguanNigerianNorthern EuropeanNorwegianOkinawanOsageOttawaPaiutePakistaniPalestinianPanamanianParaguayanPennsylvania GermanPeruvianPimaPolishPortuguesePotawatomiPuebloPuerto RicanPuget Sound SalishRomanianRussianSalvadoranSamoanScandinavianScotch-IrishScottishSeminoleSenegaleseSerbianShoshoneSierra LeoneanSiouxSlavicSlovakSloveneSomaliSouth AfricanSouth AmericanSouth American IndianSoviet UnionSpaniardSpanishSpanish AmericanSpanish American IndianSri LankanSubsaharan AfricanSudaneseSwedishSwissSyrianTaiwaneseThaiTlingit-HaidaTohono O'OdhamTonganTrinidadian and TobagonianTsimshianTurkishU.S. Virgin IslanderUgandanUkrainianUruguayanUteVenezuelanVietnameseWelshWest IndianYakamaYaquiYugoslavianYumanYup'ikZimbabwean
Immigration
NonimmigrantsImmigrantsAfghanistanAfricaAlbaniaArgentinaArmeniaAsiaAustraliaAustriaBahamasBangladeshBarbadosBelarusBelgiumBelizeBoliviaBosnia and HerzegovinaBrazilBulgariaBurma/MyanmarCabo VerdeCambodiaCameroonCanadaCaribbeanCentral AmericaChileChinaColombiaCongoCosta RicaCroatiaCubaCzechoslovakiaDenmarkDominicaDominican RepublicEastern AfricaEastern AsiaEastern EuropeEcuadorEgyptEl SalvadorEnglandEritreaEthiopiaEuropeFijiFranceGermanyGhanaGreeceGrenadaGuatemalaGuyanaHaitiHondurasHong KongHungaryIndiaIndonesiaIranIraqIrelandIsraelItalyJamaicaJapanJordanKazakhstanKenyaKoreaKuwaitLaosLatin AmericaLatviaLebanonLiberiaLithuaniaMalaysiaMexicoMicronesiaMiddle AfricaMoldovaMoroccoNepalNetherlandsNicaraguaNigeriaNorth AmericaNorth MacedoniaNorthern AfricaNorthern EuropeNorwayOceaniaPakistanPanamaPeruPhilippinesPolandPortugalRomaniaRussiaSaudi ArabiaScotlandSenegalSerbiaSierra LeoneSingaporeSomaliaSouth AfricaSouth AmericaSouth Central AsiaSouth Eastern AsiaSouthern EuropeSpainSri LankaSt. Vincent and the GrenadinesSudanSwedenSwitzerlandSyriaTaiwanThailandTrinidad and TobagoTurkeyUgandaUkraineUruguayUzbekistanVenezuelaVietnamWest IndiesWestern AfricaWestern AsiaWestern EuropeYemenZaireZimbabweAzores
Laotian
Race
Ancestry
AfghanAfricanAlaska NativeAlaskan AthabascanAlbanianAleutAlsatianAmericanApacheArabArapahoArgentineanArmenianAssyrian/Chaldean/SyriacAustralianAustrianBahamianBangladeshiBarbadianBasqueBelgianBelizeanBermudanBhutaneseBlackfeetBolivianBrazilianBritishBritish West IndianBulgarianBurmeseCajunCambodianCanadianCape VerdeanCarpatho RusynCelticCentral AmericanCentral American IndianCherokeeCheyenneChickasawChileanChineseChippewaChoctawColombianColvilleComancheCosta RicanCreeCreekCroatianCrowCubanCypriotCzechCzechoslovakianDanishDelawareDominicanDutchDutch West IndianEastern EuropeanEcuadorianEgyptianEnglishEstonianEthiopianEuropeanFijianFilipinoFinnishFrenchFrench American IndianFrench CanadianGermanGerman RussianGhanaianGreekGuamanian/ChamorroGuatemalanGuyaneseHaitianHmongHonduranHopiHoumaHungarianIcelanderIndian (Asian)IndonesianInupiatIranianIraqiIrishIroquoisIsraeliItalianJamaicanJapaneseJordanianKenyanKiowaKoreanLaotianLatvianLebaneseLiberianLithuanianLumbeeLuxembourgerMacedonianMalaysianMalteseMarshalleseMenomineeMexicanMexican American IndianMongolianMoroccanNative HawaiianNavajoNepaleseNew ZealanderNicaraguanNigerianNorthern EuropeanNorwegianOkinawanOsageOttawaPaiutePakistaniPalestinianPanamanianParaguayanPennsylvania GermanPeruvianPimaPolishPortuguesePotawatomiPuebloPuerto RicanPuget Sound SalishRomanianRussianSalvadoranSamoanScandinavianScotch-IrishScottishSeminoleSenegaleseSerbianShoshoneSierra LeoneanSiouxSlavicSlovakSloveneSomaliSouth AfricanSouth AmericanSouth American IndianSoviet UnionSpaniardSpanishSpanish AmericanSpanish American IndianSri LankanSubsaharan AfricanSudaneseSwedishSwissSyrianTaiwaneseThaiTlingit-HaidaTohono O'OdhamTonganTrinidadian and TobagonianTsimshianTurkishU.S. Virgin IslanderUgandanUkrainianUruguayanUteVenezuelanVietnameseWelshWest IndianYakamaYaquiYugoslavianYumanYup'ikZimbabwean
Immigration
NonimmigrantsImmigrantsAfghanistanAfricaAlbaniaArgentinaArmeniaAsiaAustraliaAustriaBahamasBangladeshBarbadosBelarusBelgiumBelizeBoliviaBosnia and HerzegovinaBrazilBulgariaBurma/MyanmarCabo VerdeCambodiaCameroonCanadaCaribbeanCentral AmericaChileChinaColombiaCongoCosta RicaCroatiaCubaCzechoslovakiaDenmarkDominicaDominican RepublicEastern AfricaEastern AsiaEastern EuropeEcuadorEgyptEl SalvadorEnglandEritreaEthiopiaEuropeFijiFranceGermanyGhanaGreeceGrenadaGuatemalaGuyanaHaitiHondurasHong KongHungaryIndiaIndonesiaIranIraqIrelandIsraelItalyJapanJordanKazakhstanKenyaKoreaKuwaitLaosLatin AmericaLatviaLebanonLiberiaLithuaniaMalaysiaMexicoMicronesiaMiddle AfricaMoldovaMoroccoNepalNetherlandsNicaraguaNigeriaNorth AmericaNorth MacedoniaNorthern AfricaNorthern EuropeNorwayOceaniaPakistanPanamaPeruPhilippinesPolandPortugalRomaniaRussiaSaudi ArabiaScotlandSenegalSerbiaSierra LeoneSingaporeSomaliaSouth AfricaSouth AmericaSouth Central AsiaSouth Eastern AsiaSouthern EuropeSpainSri LankaSt. Vincent and the GrenadinesSudanSwedenSwitzerlandSyriaTaiwanThailandTrinidad and TobagoTurkeyUgandaUkraineUruguayUzbekistanVenezuelaVietnamWest IndiesWestern AfricaWestern AsiaWestern EuropeYemenZaireZimbabweAzores
Child Poverty Among Boys Under 16
Income
Poverty
Unemployment
Labor Participation
Family Structure
Vehicle Availability
Education Level
Disability

Child Poverty Among Boys Under 16 Comparison

Immigrants from Jamaica

Laotians

Tragic
Exceptional
20.1%
CHILD POVERTY AMONG BOYS UNDER 16
0.0/ 100
METRIC RATING
283rd/ 347
METRIC RANK
14.3%
CHILD POVERTY AMONG BOYS UNDER 16
99.0/ 100
METRIC RATING
52nd/ 347
METRIC RANK

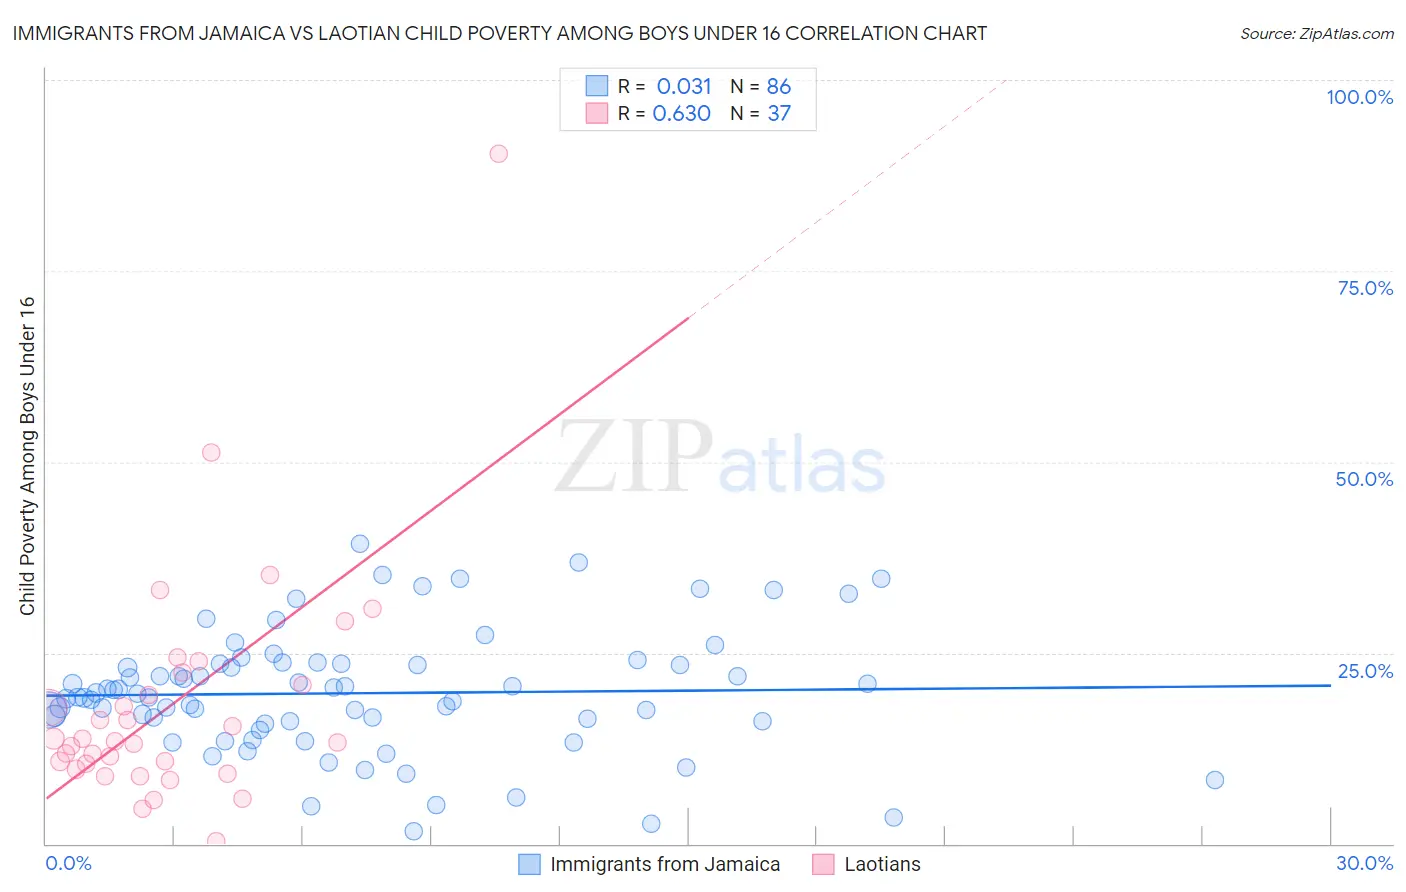
Immigrants from Jamaica vs Laotian Child Poverty Among Boys Under 16 Correlation Chart

The statistical analysis conducted on geographies consisting of 298,141,614 people shows no correlation between the proportion of Immigrants from Jamaica and poverty level among boys under the age of 16 in the United States with a correlation coefficient (R) of 0.031 and weighted average of 20.1%. Similarly, the statistical analysis conducted on geographies consisting of 223,108,732 people shows a significant positive correlation between the proportion of Laotians and poverty level among boys under the age of 16 in the United States with a correlation coefficient (R) of 0.630 and weighted average of 14.3%, a difference of 40.4%.
Immigrants from Jamaica vs Laotian Child Poverty Among Boys Under 16

Child Poverty Among Boys Under 16 Correlation Summary

MeasurementImmigrants from JamaicaLaotian
Minimum1.7%0.40%
Maximum39.3%90.3%
Range37.6%89.9%
Mean19.7%18.2%
Median19.5%13.4%
Interquartile 25% (IQ1)16.0%10.1%
Interquartile 75% (IQ3)23.5%21.5%
Interquartile Range (IQR)7.5%11.4%
Standard Deviation (Sample)7.9%15.7%
Standard Deviation (Population)7.9%15.5%

Similar Demographics by Child Poverty Among Boys Under 16

Demographics Similar to Immigrants from Jamaica by Child Poverty Among Boys Under 16

In terms of child poverty among boys under 16, the demographic groups most similar to Immigrants from Jamaica are Comanche (20.1%, a difference of 0.13%), Immigrants from Zaire (20.1%, a difference of 0.18%), Barbadian (20.2%, a difference of 0.23%), Central American (20.1%, a difference of 0.24%), and Bangladeshi (20.0%, a difference of 0.36%).
DemographicsRating | RankChild Poverty Among Boys Under 16
Sub-Saharan Africans
0.0
/100
|
#276
Tragic
20.0%
Immigrants | Barbados
0.0
/100
|
#277
Tragic
20.0%
Immigrants | West Indies
0.0
/100
|
#278
Tragic
20.0%
Bangladeshis
0.0
/100
|
#279
Tragic
20.0%
Central Americans
0.0
/100
|
#280
Tragic
20.1%
Immigrants | Zaire
0.0
/100
|
#281
Tragic
20.1%
Comanche
0.0
/100
|
#282
Tragic
20.1%
Immigrants | Jamaica
0.0
/100
|
#283
Tragic
20.1%
Barbadians
0.0
/100
|
#284
Tragic
20.2%
Arapaho
0.0
/100
|
#285
Tragic
20.2%
West Indians
0.0
/100
|
#286
Tragic
20.3%
Immigrants | Belize
0.0
/100
|
#287
Tragic
20.3%
Immigrants | St. Vincent and the Grenadines
0.0
/100
|
#288
Tragic
20.3%
Blackfeet
0.0
/100
|
#289
Tragic
20.4%
Senegalese
0.0
/100
|
#290
Tragic
20.6%

Demographics Similar to Laotians by Child Poverty Among Boys Under 16

In terms of child poverty among boys under 16, the demographic groups most similar to Laotians are Immigrants from Philippines (14.3%, a difference of 0.040%), Immigrants from Serbia (14.3%, a difference of 0.12%), Immigrants from Pakistan (14.3%, a difference of 0.17%), Zimbabwean (14.3%, a difference of 0.17%), and Polish (14.4%, a difference of 0.28%).
DemographicsRating | RankChild Poverty Among Boys Under 16
Immigrants | Scotland
99.4
/100
|
#45
Exceptional
14.1%
Greeks
99.4
/100
|
#46
Exceptional
14.1%
Immigrants | Moldova
99.4
/100
|
#47
Exceptional
14.1%
Immigrants | Indonesia
99.4
/100
|
#48
Exceptional
14.1%
Czechs
99.3
/100
|
#49
Exceptional
14.1%
Italians
99.2
/100
|
#50
Exceptional
14.2%
Immigrants | Greece
99.2
/100
|
#51
Exceptional
14.2%
Laotians
99.0
/100
|
#52
Exceptional
14.3%
Immigrants | Philippines
99.0
/100
|
#53
Exceptional
14.3%
Immigrants | Serbia
99.0
/100
|
#54
Exceptional
14.3%
Immigrants | Pakistan
99.0
/100
|
#55
Exceptional
14.3%
Zimbabweans
99.0
/100
|
#56
Exceptional
14.3%
Poles
98.9
/100
|
#57
Exceptional
14.4%
Immigrants | Sweden
98.9
/100
|
#58
Exceptional
14.4%
Immigrants | Czechoslovakia
98.9
/100
|
#59
Exceptional
14.4%