Immigrants from Jamaica vs Bolivian Single Mother Poverty

COMPARE

Immigrants from Jamaica
Race
Ancestry
AfghanAfricanAlaska NativeAlaskan AthabascanAlbanianAleutAlsatianAmericanApacheArabArapahoArgentineanArmenianAssyrian/Chaldean/SyriacAustralianAustrianBahamianBangladeshiBarbadianBasqueBelgianBelizeanBermudanBhutaneseBlackfeetBrazilianBritishBritish West IndianBulgarianBurmeseCajunCambodianCanadianCape VerdeanCarpatho RusynCelticCentral AmericanCentral American IndianCherokeeCheyenneChickasawChileanChineseChippewaChoctawColombianColvilleComancheCosta RicanCreeCreekCroatianCrowCubanCypriotCzechCzechoslovakianDanishDelawareDominicanDutchDutch West IndianEastern EuropeanEcuadorianEgyptianEnglishEstonianEthiopianEuropeanFijianFilipinoFinnishFrenchFrench American IndianFrench CanadianGermanGerman RussianGhanaianGreekGuamanian/ChamorroGuatemalanGuyaneseHaitianHmongHonduranHopiHoumaHungarianIcelanderIndian (Asian)IndonesianInupiatIranianIraqiIrishIroquoisIsraeliItalianJamaicanJapaneseJordanianKenyanKiowaKoreanLaotianLatvianLebaneseLiberianLithuanianLumbeeLuxembourgerMacedonianMalaysianMalteseMarshalleseMenomineeMexicanMexican American IndianMongolianMoroccanNative HawaiianNavajoNepaleseNew ZealanderNicaraguanNigerianNorthern EuropeanNorwegianOkinawanOsageOttawaPaiutePakistaniPalestinianPanamanianParaguayanPennsylvania GermanPeruvianPimaPolishPortuguesePotawatomiPuebloPuerto RicanPuget Sound SalishRomanianRussianSalvadoranSamoanScandinavianScotch-IrishScottishSeminoleSenegaleseSerbianShoshoneSierra LeoneanSiouxSlavicSlovakSloveneSomaliSouth AfricanSouth AmericanSouth American IndianSoviet UnionSpaniardSpanishSpanish AmericanSpanish American IndianSri LankanSubsaharan AfricanSudaneseSwedishSwissSyrianTaiwaneseThaiTlingit-HaidaTohono O'OdhamTonganTrinidadian and TobagonianTsimshianTurkishU.S. Virgin IslanderUgandanUkrainianUruguayanUteVenezuelanVietnameseWelshWest IndianYakamaYaquiYugoslavianYumanYup'ikZimbabwean
Immigration
NonimmigrantsImmigrantsAfghanistanAfricaAlbaniaArgentinaArmeniaAsiaAustraliaAustriaBahamasBangladeshBarbadosBelarusBelgiumBelizeBoliviaBosnia and HerzegovinaBrazilBulgariaBurma/MyanmarCabo VerdeCambodiaCameroonCanadaCaribbeanCentral AmericaChileChinaColombiaCongoCosta RicaCroatiaCubaCzechoslovakiaDenmarkDominicaDominican RepublicEastern AfricaEastern AsiaEastern EuropeEcuadorEgyptEl SalvadorEnglandEritreaEthiopiaEuropeFijiFranceGermanyGhanaGreeceGrenadaGuatemalaGuyanaHaitiHondurasHong KongHungaryIndiaIndonesiaIranIraqIrelandIsraelItalyJamaicaJapanJordanKazakhstanKenyaKoreaKuwaitLaosLatin AmericaLatviaLebanonLiberiaLithuaniaMalaysiaMexicoMicronesiaMiddle AfricaMoldovaMoroccoNepalNetherlandsNicaraguaNigeriaNorth AmericaNorth MacedoniaNorthern AfricaNorthern EuropeNorwayOceaniaPakistanPanamaPeruPhilippinesPolandPortugalRomaniaRussiaSaudi ArabiaScotlandSenegalSerbiaSierra LeoneSingaporeSomaliaSouth AfricaSouth AmericaSouth Central AsiaSouth Eastern AsiaSouthern EuropeSpainSri LankaSt. Vincent and the GrenadinesSudanSwedenSwitzerlandSyriaTaiwanThailandTrinidad and TobagoTurkeyUgandaUkraineUruguayUzbekistanVenezuelaVietnamWest IndiesWestern AfricaWestern AsiaWestern EuropeYemenZaireZimbabweAzores
Bolivian
Race
Ancestry
AfghanAfricanAlaska NativeAlaskan AthabascanAlbanianAleutAlsatianAmericanApacheArabArapahoArgentineanArmenianAssyrian/Chaldean/SyriacAustralianAustrianBahamianBangladeshiBarbadianBasqueBelgianBelizeanBermudanBhutaneseBlackfeetBolivianBrazilianBritishBritish West IndianBulgarianBurmeseCajunCambodianCanadianCape VerdeanCarpatho RusynCelticCentral AmericanCentral American IndianCherokeeCheyenneChickasawChileanChineseChippewaChoctawColombianColvilleComancheCosta RicanCreeCreekCroatianCrowCubanCypriotCzechCzechoslovakianDanishDelawareDominicanDutchDutch West IndianEastern EuropeanEcuadorianEgyptianEnglishEstonianEthiopianEuropeanFijianFilipinoFinnishFrenchFrench American IndianFrench CanadianGermanGerman RussianGhanaianGreekGuamanian/ChamorroGuatemalanGuyaneseHaitianHmongHonduranHopiHoumaHungarianIcelanderIndian (Asian)IndonesianInupiatIranianIraqiIrishIroquoisIsraeliItalianJamaicanJapaneseJordanianKenyanKiowaKoreanLaotianLatvianLebaneseLiberianLithuanianLumbeeLuxembourgerMacedonianMalaysianMalteseMarshalleseMenomineeMexicanMexican American IndianMongolianMoroccanNative HawaiianNavajoNepaleseNew ZealanderNicaraguanNigerianNorthern EuropeanNorwegianOkinawanOsageOttawaPaiutePakistaniPalestinianPanamanianParaguayanPennsylvania GermanPeruvianPimaPolishPortuguesePotawatomiPuebloPuerto RicanPuget Sound SalishRomanianRussianSalvadoranSamoanScandinavianScotch-IrishScottishSeminoleSenegaleseSerbianShoshoneSierra LeoneanSiouxSlavicSlovakSloveneSomaliSouth AfricanSouth AmericanSouth American IndianSoviet UnionSpaniardSpanishSpanish AmericanSpanish American IndianSri LankanSubsaharan AfricanSudaneseSwedishSwissSyrianTaiwaneseThaiTlingit-HaidaTohono O'OdhamTonganTrinidadian and TobagonianTsimshianTurkishU.S. Virgin IslanderUgandanUkrainianUruguayanUteVenezuelanVietnameseWelshWest IndianYakamaYaquiYugoslavianYumanYup'ikZimbabwean
Immigration
NonimmigrantsImmigrantsAfghanistanAfricaAlbaniaArgentinaArmeniaAsiaAustraliaAustriaBahamasBangladeshBarbadosBelarusBelgiumBelizeBoliviaBosnia and HerzegovinaBrazilBulgariaBurma/MyanmarCabo VerdeCambodiaCameroonCanadaCaribbeanCentral AmericaChileChinaColombiaCongoCosta RicaCroatiaCubaCzechoslovakiaDenmarkDominicaDominican RepublicEastern AfricaEastern AsiaEastern EuropeEcuadorEgyptEl SalvadorEnglandEritreaEthiopiaEuropeFijiFranceGermanyGhanaGreeceGrenadaGuatemalaGuyanaHaitiHondurasHong KongHungaryIndiaIndonesiaIranIraqIrelandIsraelItalyJapanJordanKazakhstanKenyaKoreaKuwaitLaosLatin AmericaLatviaLebanonLiberiaLithuaniaMalaysiaMexicoMicronesiaMiddle AfricaMoldovaMoroccoNepalNetherlandsNicaraguaNigeriaNorth AmericaNorth MacedoniaNorthern AfricaNorthern EuropeNorwayOceaniaPakistanPanamaPeruPhilippinesPolandPortugalRomaniaRussiaSaudi ArabiaScotlandSenegalSerbiaSierra LeoneSingaporeSomaliaSouth AfricaSouth AmericaSouth Central AsiaSouth Eastern AsiaSouthern EuropeSpainSri LankaSt. Vincent and the GrenadinesSudanSwedenSwitzerlandSyriaTaiwanThailandTrinidad and TobagoTurkeyUgandaUkraineUruguayUzbekistanVenezuelaVietnamWest IndiesWestern AfricaWestern AsiaWestern EuropeYemenZaireZimbabweAzores
Single Mother Poverty
Income
Poverty
Unemployment
Labor Participation
Family Structure
Vehicle Availability
Education Level
Disability

Single Mother Poverty Comparison

Immigrants from Jamaica

Bolivians

Fair
Exceptional
29.6%
SINGLE MOTHER POVERTY
22.0/ 100
METRIC RATING
197th/ 347
METRIC RANK
25.9%
SINGLE MOTHER POVERTY
100.0/ 100
METRIC RATING
16th/ 347
METRIC RANK

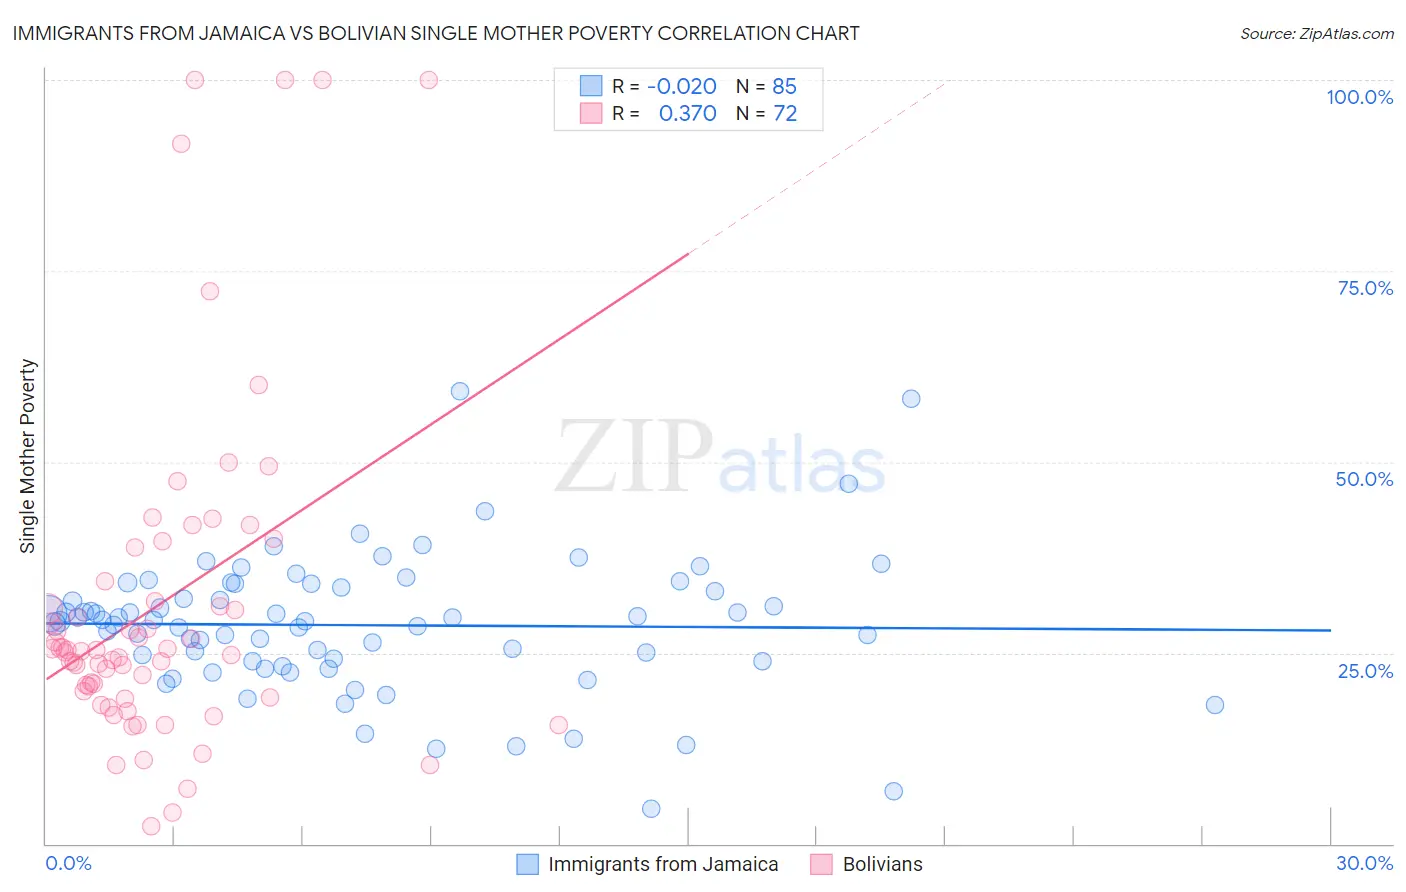
Immigrants from Jamaica vs Bolivian Single Mother Poverty Correlation Chart

The statistical analysis conducted on geographies consisting of 296,527,600 people shows no correlation between the proportion of Immigrants from Jamaica and poverty level among single mothers in the United States with a correlation coefficient (R) of -0.020 and weighted average of 29.6%. Similarly, the statistical analysis conducted on geographies consisting of 182,525,301 people shows a mild positive correlation between the proportion of Bolivians and poverty level among single mothers in the United States with a correlation coefficient (R) of 0.370 and weighted average of 25.9%, a difference of 14.3%.
Immigrants from Jamaica vs Bolivian Single Mother Poverty

Single Mother Poverty Correlation Summary

MeasurementImmigrants from JamaicaBolivian
Minimum4.6%2.2%
Maximum59.3%100.0%
Range54.7%97.8%
Mean28.6%31.3%
Median29.2%25.3%
Interquartile 25% (IQ1)23.9%19.6%
Interquartile 75% (IQ3)33.8%33.1%
Interquartile Range (IQR)9.9%13.5%
Standard Deviation (Sample)8.9%22.0%
Standard Deviation (Population)8.9%21.8%

Similar Demographics by Single Mother Poverty

Demographics Similar to Immigrants from Jamaica by Single Mother Poverty

In terms of single mother poverty, the demographic groups most similar to Immigrants from Jamaica are Trinidadian and Tobagonian (29.6%, a difference of 0.020%), Cuban (29.6%, a difference of 0.080%), Spanish American Indian (29.6%, a difference of 0.10%), Panamanian (29.6%, a difference of 0.14%), and Slavic (29.6%, a difference of 0.17%).
DemographicsRating | RankSingle Mother Poverty
Immigrants | Germany
30.4
/100
|
#190
Fair
29.5%
Immigrants | Trinidad and Tobago
29.2
/100
|
#191
Fair
29.5%
Moroccans
28.6
/100
|
#192
Fair
29.5%
Basques
28.3
/100
|
#193
Fair
29.5%
Icelanders
26.1
/100
|
#194
Fair
29.5%
Slavs
24.5
/100
|
#195
Fair
29.6%
Spanish American Indians
23.4
/100
|
#196
Fair
29.6%
Immigrants | Jamaica
22.0
/100
|
#197
Fair
29.6%
Trinidadians and Tobagonians
21.7
/100
|
#198
Fair
29.6%
Cubans
20.8
/100
|
#199
Fair
29.6%
Panamanians
20.0
/100
|
#200
Fair
29.6%
Belgians
18.8
/100
|
#201
Poor
29.7%
Malaysians
17.4
/100
|
#202
Poor
29.7%
Swiss
17.2
/100
|
#203
Poor
29.7%
Immigrants | Immigrants
16.6
/100
|
#204
Poor
29.7%

Demographics Similar to Bolivians by Single Mother Poverty

In terms of single mother poverty, the demographic groups most similar to Bolivians are Asian (26.0%, a difference of 0.18%), Immigrants from Ireland (25.8%, a difference of 0.29%), Immigrants from Pakistan (26.0%, a difference of 0.46%), Immigrants from Singapore (25.8%, a difference of 0.47%), and Immigrants from Eastern Asia (26.1%, a difference of 0.61%).
DemographicsRating | RankSingle Mother Poverty
Immigrants | Lithuania
100.0
/100
|
#9
Exceptional
25.2%
Immigrants | South Central Asia
100.0
/100
|
#10
Exceptional
25.3%
Iranians
100.0
/100
|
#11
Exceptional
25.5%
Bhutanese
100.0
/100
|
#12
Exceptional
25.6%
Indians (Asian)
100.0
/100
|
#13
Exceptional
25.8%
Immigrants | Singapore
100.0
/100
|
#14
Exceptional
25.8%
Immigrants | Ireland
100.0
/100
|
#15
Exceptional
25.8%
Bolivians
100.0
/100
|
#16
Exceptional
25.9%
Asians
100.0
/100
|
#17
Exceptional
26.0%
Immigrants | Pakistan
100.0
/100
|
#18
Exceptional
26.0%
Immigrants | Eastern Asia
100.0
/100
|
#19
Exceptional
26.1%
Immigrants | China
100.0
/100
|
#20
Exceptional
26.1%
Immigrants | Bolivia
100.0
/100
|
#21
Exceptional
26.2%
Immigrants | Korea
100.0
/100
|
#22
Exceptional
26.2%
Burmese
100.0
/100
|
#23
Exceptional
26.2%