Immigrants from Italy vs Immigrants from Panama Single Father Poverty
COMPARE
Immigrants from Italy
Immigrants from Panama
Single Father Poverty
Single Father Poverty Comparison
Immigrants from Italy
Immigrants from Panama
16.4%
SINGLE FATHER POVERTY
35.7/ 100
METRIC RATING
182nd/ 347
METRIC RANK
15.9%
SINGLE FATHER POVERTY
91.3/ 100
METRIC RATING
124th/ 347
METRIC RANK
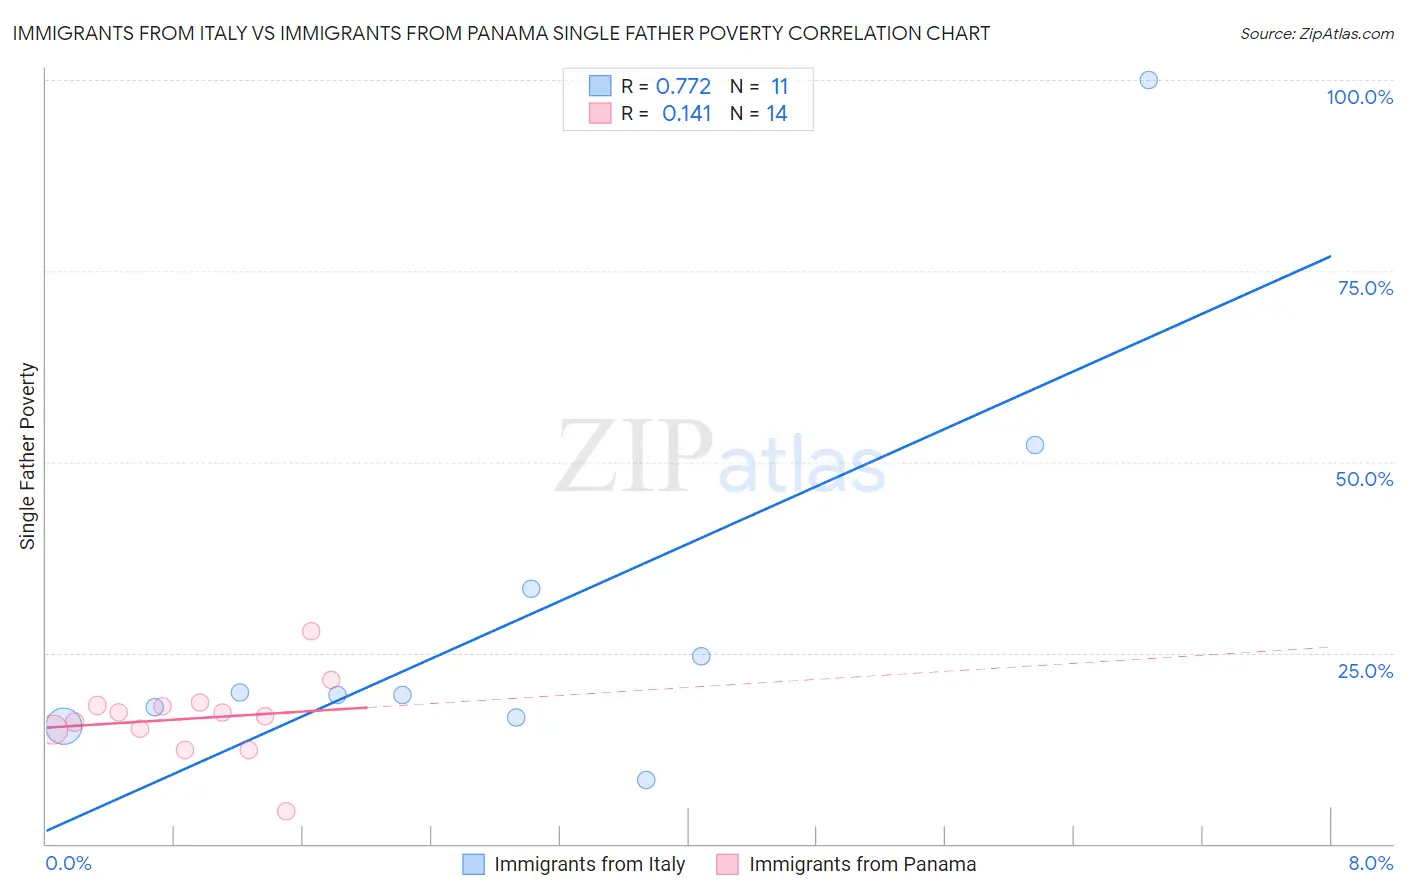
Immigrants from Italy vs Immigrants from Panama Single Father Poverty Correlation Chart
The statistical analysis conducted on geographies consisting of 255,121,399 people shows a strong positive correlation between the proportion of Immigrants from Italy and poverty level among single fathers in the United States with a correlation coefficient (R) of 0.772 and weighted average of 16.4%. Similarly, the statistical analysis conducted on geographies consisting of 190,509,085 people shows a poor positive correlation between the proportion of Immigrants from Panama and poverty level among single fathers in the United States with a correlation coefficient (R) of 0.141 and weighted average of 15.9%, a difference of 3.3%.
Single Father Poverty Correlation Summary
| Measurement | Immigrants from Italy | Immigrants from Panama |
| Minimum | 8.4% | 4.3% |
| Maximum | 100.0% | 27.8% |
| Range | 91.6% | 23.5% |
| Mean | 29.7% | 16.4% |
| Median | 19.5% | 16.9% |
| Interquartile 25% (IQ1) | 16.5% | 15.0% |
| Interquartile 75% (IQ3) | 33.3% | 18.1% |
| Interquartile Range (IQR) | 16.8% | 3.1% |
| Standard Deviation (Sample) | 26.0% | 5.2% |
| Standard Deviation (Population) | 24.8% | 5.0% |
Similar Demographics by Single Father Poverty
Demographics Similar to Immigrants from Italy by Single Father Poverty
In terms of single father poverty, the demographic groups most similar to Immigrants from Italy are Immigrants from Western Africa (16.4%, a difference of 0.010%), Aleut (16.4%, a difference of 0.020%), Cambodian (16.4%, a difference of 0.050%), Immigrants from Latin America (16.4%, a difference of 0.070%), and Panamanian (16.4%, a difference of 0.11%).
| Demographics | Rating | Rank | Single Father Poverty |
| Immigrants | Ecuador | 49.7 /100 | #175 | Average 16.3% |
| Vietnamese | 48.0 /100 | #176 | Average 16.3% |
| Immigrants | South Africa | 44.2 /100 | #177 | Average 16.3% |
| Immigrants | Cuba | 41.6 /100 | #178 | Average 16.4% |
| Serbians | 40.9 /100 | #179 | Average 16.4% |
| Immigrants | Latin America | 37.2 /100 | #180 | Fair 16.4% |
| Immigrants | Western Africa | 36.0 /100 | #181 | Fair 16.4% |
| Immigrants | Italy | 35.7 /100 | #182 | Fair 16.4% |
| Aleuts | 35.3 /100 | #183 | Fair 16.4% |
| Cambodians | 34.6 /100 | #184 | Fair 16.4% |
| Panamanians | 33.6 /100 | #185 | Fair 16.4% |
| Immigrants | Venezuela | 31.0 /100 | #186 | Fair 16.4% |
| Ukrainians | 30.4 /100 | #187 | Fair 16.4% |
| Russians | 30.1 /100 | #188 | Fair 16.4% |
| Latvians | 28.9 /100 | #189 | Fair 16.5% |
Demographics Similar to Immigrants from Panama by Single Father Poverty
In terms of single father poverty, the demographic groups most similar to Immigrants from Panama are Palestinian (15.9%, a difference of 0.010%), Iraqi (15.9%, a difference of 0.010%), Hmong (15.9%, a difference of 0.020%), Immigrants from Liberia (15.9%, a difference of 0.030%), and Sudanese (15.9%, a difference of 0.040%).
| Demographics | Rating | Rank | Single Father Poverty |
| Immigrants | Colombia | 92.6 /100 | #117 | Exceptional 15.8% |
| Immigrants | Eastern Europe | 92.5 /100 | #118 | Exceptional 15.8% |
| Immigrants | Belarus | 92.4 /100 | #119 | Exceptional 15.8% |
| Uruguayans | 92.1 /100 | #120 | Exceptional 15.9% |
| Immigrants | Immigrants | 91.9 /100 | #121 | Exceptional 15.9% |
| Sudanese | 91.6 /100 | #122 | Exceptional 15.9% |
| Palestinians | 91.3 /100 | #123 | Exceptional 15.9% |
| Immigrants | Panama | 91.3 /100 | #124 | Exceptional 15.9% |
| Iraqis | 91.2 /100 | #125 | Exceptional 15.9% |
| Hmong | 91.1 /100 | #126 | Exceptional 15.9% |
| Immigrants | Liberia | 91.1 /100 | #127 | Exceptional 15.9% |
| Immigrants | Nigeria | 90.8 /100 | #128 | Exceptional 15.9% |
| Immigrants | West Indies | 90.8 /100 | #129 | Exceptional 15.9% |
| Norwegians | 90.2 /100 | #130 | Exceptional 15.9% |
| Nicaraguans | 90.1 /100 | #131 | Exceptional 15.9% |