Immigrants from Italy vs Brazilian Poverty
COMPARE
Immigrants from Italy
Brazilian
Poverty
Poverty Comparison
Immigrants from Italy
Brazilians
11.2%
POVERTY
97.9/ 100
METRIC RATING
61st/ 347
METRIC RANK
11.9%
POVERTY
79.7/ 100
METRIC RATING
143rd/ 347
METRIC RANK
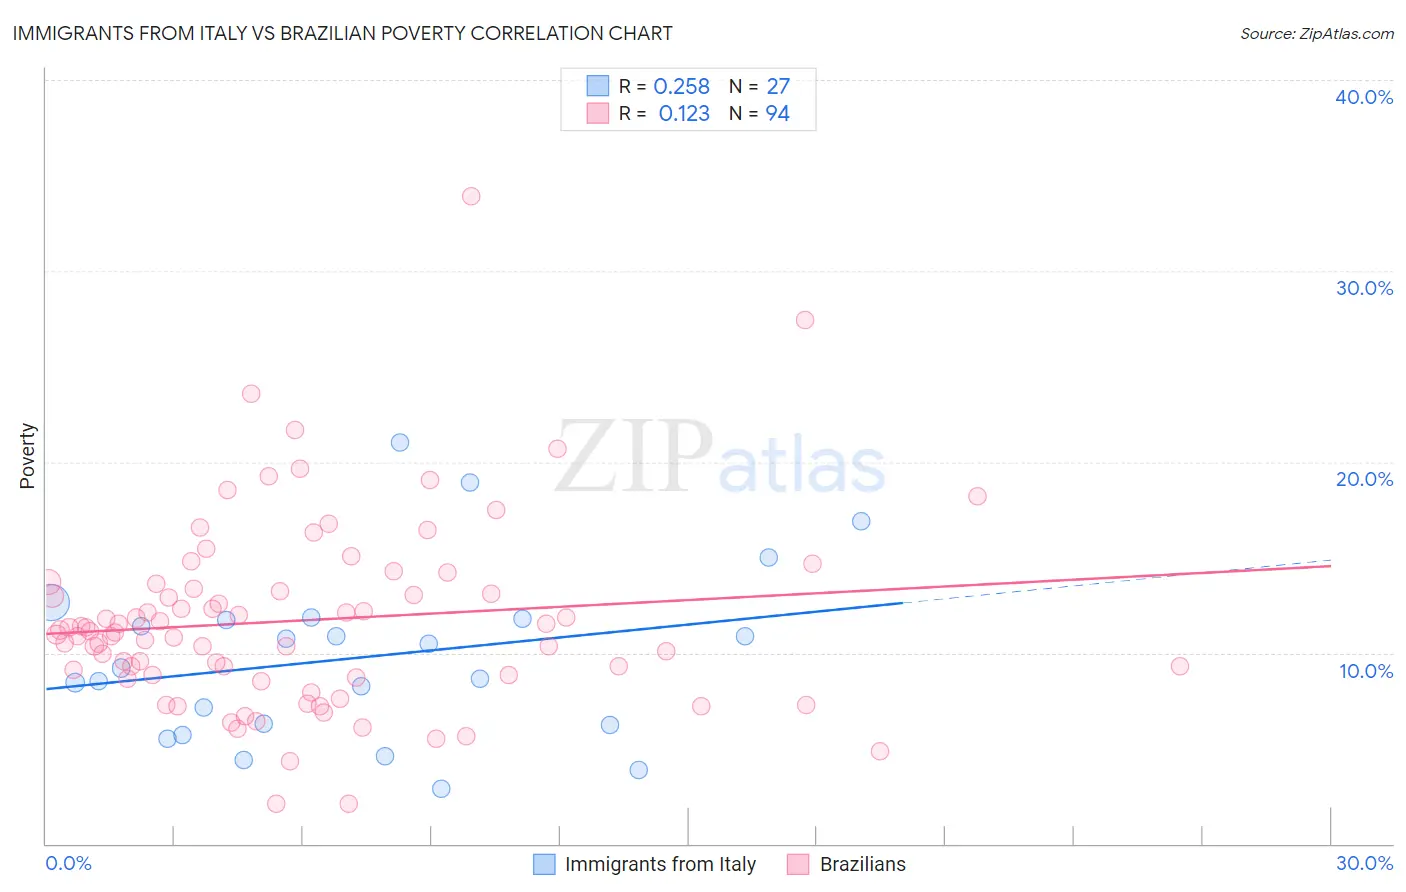
Immigrants from Italy vs Brazilian Poverty Correlation Chart
The statistical analysis conducted on geographies consisting of 324,121,527 people shows a weak positive correlation between the proportion of Immigrants from Italy and poverty level in the United States with a correlation coefficient (R) of 0.258 and weighted average of 11.2%. Similarly, the statistical analysis conducted on geographies consisting of 323,736,461 people shows a poor positive correlation between the proportion of Brazilians and poverty level in the United States with a correlation coefficient (R) of 0.123 and weighted average of 11.9%, a difference of 6.6%.
Poverty Correlation Summary
| Measurement | Immigrants from Italy | Brazilian |
| Minimum | 2.9% | 2.1% |
| Maximum | 21.0% | 33.9% |
| Range | 18.1% | 31.8% |
| Mean | 9.8% | 11.7% |
| Median | 9.2% | 11.1% |
| Interquartile 25% (IQ1) | 6.2% | 8.8% |
| Interquartile 75% (IQ3) | 11.8% | 13.3% |
| Interquartile Range (IQR) | 5.5% | 4.5% |
| Standard Deviation (Sample) | 4.5% | 5.0% |
| Standard Deviation (Population) | 4.4% | 5.0% |
Similar Demographics by Poverty
Demographics Similar to Immigrants from Italy by Poverty
In terms of poverty, the demographic groups most similar to Immigrants from Italy are Austrian (11.2%, a difference of 0.030%), Ukrainian (11.2%, a difference of 0.040%), Immigrants from Sri Lanka (11.2%, a difference of 0.060%), Immigrants from Europe (11.2%, a difference of 0.22%), and Swiss (11.2%, a difference of 0.25%).
| Demographics | Rating | Rank | Poverty |
| Immigrants | Bulgaria | 98.5 /100 | #54 | Exceptional 11.1% |
| Immigrants | Serbia | 98.5 /100 | #55 | Exceptional 11.1% |
| Estonians | 98.2 /100 | #56 | Exceptional 11.1% |
| Scandinavians | 98.2 /100 | #57 | Exceptional 11.1% |
| Germans | 98.1 /100 | #58 | Exceptional 11.1% |
| Immigrants | Europe | 98.0 /100 | #59 | Exceptional 11.2% |
| Immigrants | Sri Lanka | 97.9 /100 | #60 | Exceptional 11.2% |
| Immigrants | Italy | 97.9 /100 | #61 | Exceptional 11.2% |
| Austrians | 97.8 /100 | #62 | Exceptional 11.2% |
| Ukrainians | 97.8 /100 | #63 | Exceptional 11.2% |
| Swiss | 97.7 /100 | #64 | Exceptional 11.2% |
| Immigrants | Asia | 97.5 /100 | #65 | Exceptional 11.2% |
| Immigrants | Netherlands | 97.5 /100 | #66 | Exceptional 11.2% |
| Immigrants | Australia | 97.4 /100 | #67 | Exceptional 11.2% |
| Slovaks | 97.4 /100 | #68 | Exceptional 11.2% |
Demographics Similar to Brazilians by Poverty
In terms of poverty, the demographic groups most similar to Brazilians are Basque (11.9%, a difference of 0.11%), Immigrants from France (11.9%, a difference of 0.12%), Immigrants from Peru (11.9%, a difference of 0.22%), Icelander (11.9%, a difference of 0.27%), and Pakistani (11.9%, a difference of 0.41%).
| Demographics | Rating | Rank | Poverty |
| Chileans | 84.2 /100 | #136 | Excellent 11.8% |
| Immigrants | Switzerland | 83.0 /100 | #137 | Excellent 11.8% |
| Immigrants | Jordan | 82.4 /100 | #138 | Excellent 11.9% |
| Pakistanis | 82.2 /100 | #139 | Excellent 11.9% |
| Immigrants | Peru | 81.1 /100 | #140 | Excellent 11.9% |
| Immigrants | France | 80.5 /100 | #141 | Excellent 11.9% |
| Basques | 80.4 /100 | #142 | Excellent 11.9% |
| Brazilians | 79.7 /100 | #143 | Good 11.9% |
| Icelanders | 77.9 /100 | #144 | Good 11.9% |
| Syrians | 75.1 /100 | #145 | Good 12.0% |
| Afghans | 74.9 /100 | #146 | Good 12.0% |
| Immigrants | Bosnia and Herzegovina | 73.7 /100 | #147 | Good 12.0% |
| Immigrants | Germany | 72.7 /100 | #148 | Good 12.0% |
| Immigrants | Malaysia | 72.7 /100 | #149 | Good 12.0% |
| Immigrants | Kazakhstan | 72.3 /100 | #150 | Good 12.0% |