Immigrants from Israel vs South African Seniors Poverty Over the Age of 75
COMPARE
Immigrants from Israel
South African
Seniors Poverty Over the Age of 75
Seniors Poverty Over the Age of 75 Comparison
Immigrants from Israel
South Africans
13.3%
SENIORS POVERTY OVER THE AGE OF 75
1.1/ 100
METRIC RATING
234th/ 347
METRIC RANK
11.7%
SENIORS POVERTY OVER THE AGE OF 75
89.3/ 100
METRIC RATING
109th/ 347
METRIC RANK
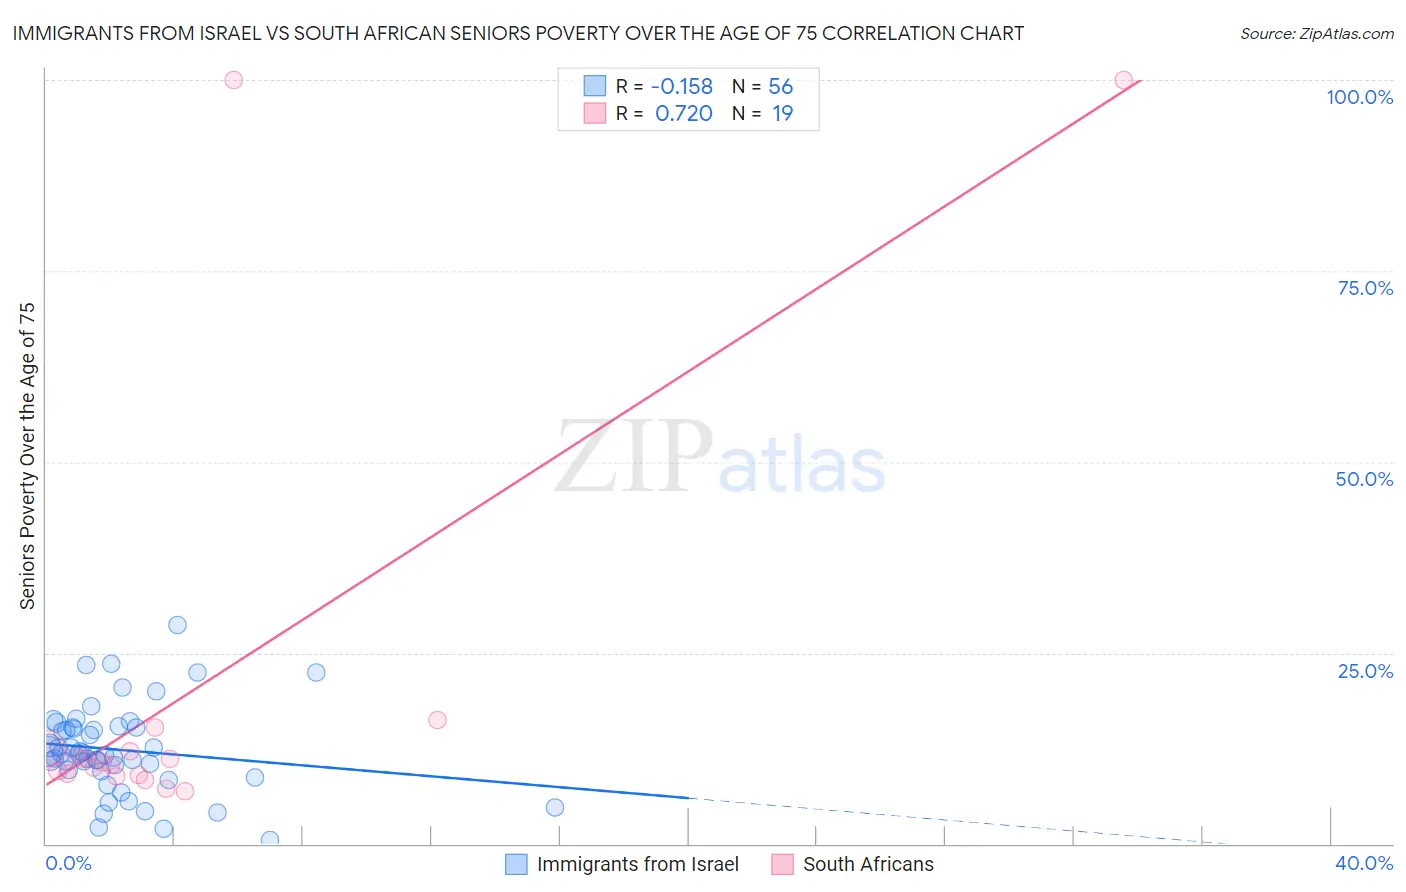
Immigrants from Israel vs South African Seniors Poverty Over the Age of 75 Correlation Chart
The statistical analysis conducted on geographies consisting of 208,700,044 people shows a poor negative correlation between the proportion of Immigrants from Israel and poverty level among seniors over the age of 75 in the United States with a correlation coefficient (R) of -0.158 and weighted average of 13.3%. Similarly, the statistical analysis conducted on geographies consisting of 181,308,648 people shows a strong positive correlation between the proportion of South Africans and poverty level among seniors over the age of 75 in the United States with a correlation coefficient (R) of 0.720 and weighted average of 11.7%, a difference of 14.1%.
Seniors Poverty Over the Age of 75 Correlation Summary
| Measurement | Immigrants from Israel | South African |
| Minimum | 0.44% | 6.9% |
| Maximum | 28.6% | 100.0% |
| Range | 28.2% | 93.1% |
| Mean | 12.3% | 20.0% |
| Median | 11.8% | 10.6% |
| Interquartile 25% (IQ1) | 9.6% | 9.0% |
| Interquartile 75% (IQ3) | 15.3% | 12.5% |
| Interquartile Range (IQR) | 5.7% | 3.5% |
| Standard Deviation (Sample) | 5.8% | 28.3% |
| Standard Deviation (Population) | 5.7% | 27.5% |
Similar Demographics by Seniors Poverty Over the Age of 75
Demographics Similar to Immigrants from Israel by Seniors Poverty Over the Age of 75
In terms of seniors poverty over the age of 75, the demographic groups most similar to Immigrants from Israel are Japanese (13.3%, a difference of 0.30%), Moroccan (13.3%, a difference of 0.31%), Immigrants from Costa Rica (13.3%, a difference of 0.35%), Immigrants from Chile (13.3%, a difference of 0.37%), and Alaskan Athabascan (13.4%, a difference of 0.49%).
| Demographics | Rating | Rank | Seniors Poverty Over the Age of 75 |
| Cree | 2.3 /100 | #227 | Tragic 13.1% |
| Israelis | 2.0 /100 | #228 | Tragic 13.2% |
| Somalis | 1.6 /100 | #229 | Tragic 13.2% |
| Immigrants | China | 1.5 /100 | #230 | Tragic 13.2% |
| Sub-Saharan Africans | 1.5 /100 | #231 | Tragic 13.2% |
| Immigrants | Chile | 1.3 /100 | #232 | Tragic 13.3% |
| Immigrants | Costa Rica | 1.3 /100 | #233 | Tragic 13.3% |
| Immigrants | Israel | 1.1 /100 | #234 | Tragic 13.3% |
| Japanese | 0.9 /100 | #235 | Tragic 13.3% |
| Moroccans | 0.9 /100 | #236 | Tragic 13.3% |
| Alaskan Athabascans | 0.8 /100 | #237 | Tragic 13.4% |
| Peruvians | 0.8 /100 | #238 | Tragic 13.4% |
| Panamanians | 0.8 /100 | #239 | Tragic 13.4% |
| Argentineans | 0.7 /100 | #240 | Tragic 13.4% |
| Immigrants | Russia | 0.6 /100 | #241 | Tragic 13.4% |
Demographics Similar to South Africans by Seniors Poverty Over the Age of 75
In terms of seniors poverty over the age of 75, the demographic groups most similar to South Africans are Turkish (11.7%, a difference of 0.0%), Immigrants from Oceania (11.7%, a difference of 0.020%), Russian (11.6%, a difference of 0.13%), Immigrants from Jordan (11.7%, a difference of 0.15%), and Burmese (11.7%, a difference of 0.15%).
| Demographics | Rating | Rank | Seniors Poverty Over the Age of 75 |
| Guamanians/Chamorros | 90.6 /100 | #102 | Exceptional 11.6% |
| Immigrants | Kuwait | 90.5 /100 | #103 | Exceptional 11.6% |
| Immigrants | Singapore | 90.3 /100 | #104 | Exceptional 11.6% |
| Chickasaw | 90.2 /100 | #105 | Exceptional 11.6% |
| Russians | 89.9 /100 | #106 | Excellent 11.6% |
| Immigrants | Oceania | 89.4 /100 | #107 | Excellent 11.7% |
| Turks | 89.4 /100 | #108 | Excellent 11.7% |
| South Africans | 89.3 /100 | #109 | Excellent 11.7% |
| Immigrants | Jordan | 88.7 /100 | #110 | Excellent 11.7% |
| Burmese | 88.7 /100 | #111 | Excellent 11.7% |
| Immigrants | Bolivia | 88.4 /100 | #112 | Excellent 11.7% |
| Immigrants | Czechoslovakia | 87.0 /100 | #113 | Excellent 11.7% |
| Ukrainians | 86.9 /100 | #114 | Excellent 11.7% |
| New Zealanders | 86.3 /100 | #115 | Excellent 11.7% |
| Iraqis | 86.3 /100 | #116 | Excellent 11.7% |