Immigrants from Israel vs Finnish Female Poverty Among 18-24 Year Olds
COMPARE
Immigrants from Israel
Finnish
Female Poverty Among 18-24 Year Olds
Female Poverty Among 18-24 Year Olds Comparison
Immigrants from Israel
Finns
20.4%
FEMALE POVERTY AMONG 18-24 YEAR OLDS
24.4/ 100
METRIC RATING
192nd/ 347
METRIC RANK
20.8%
FEMALE POVERTY AMONG 18-24 YEAR OLDS
6.0/ 100
METRIC RATING
232nd/ 347
METRIC RANK
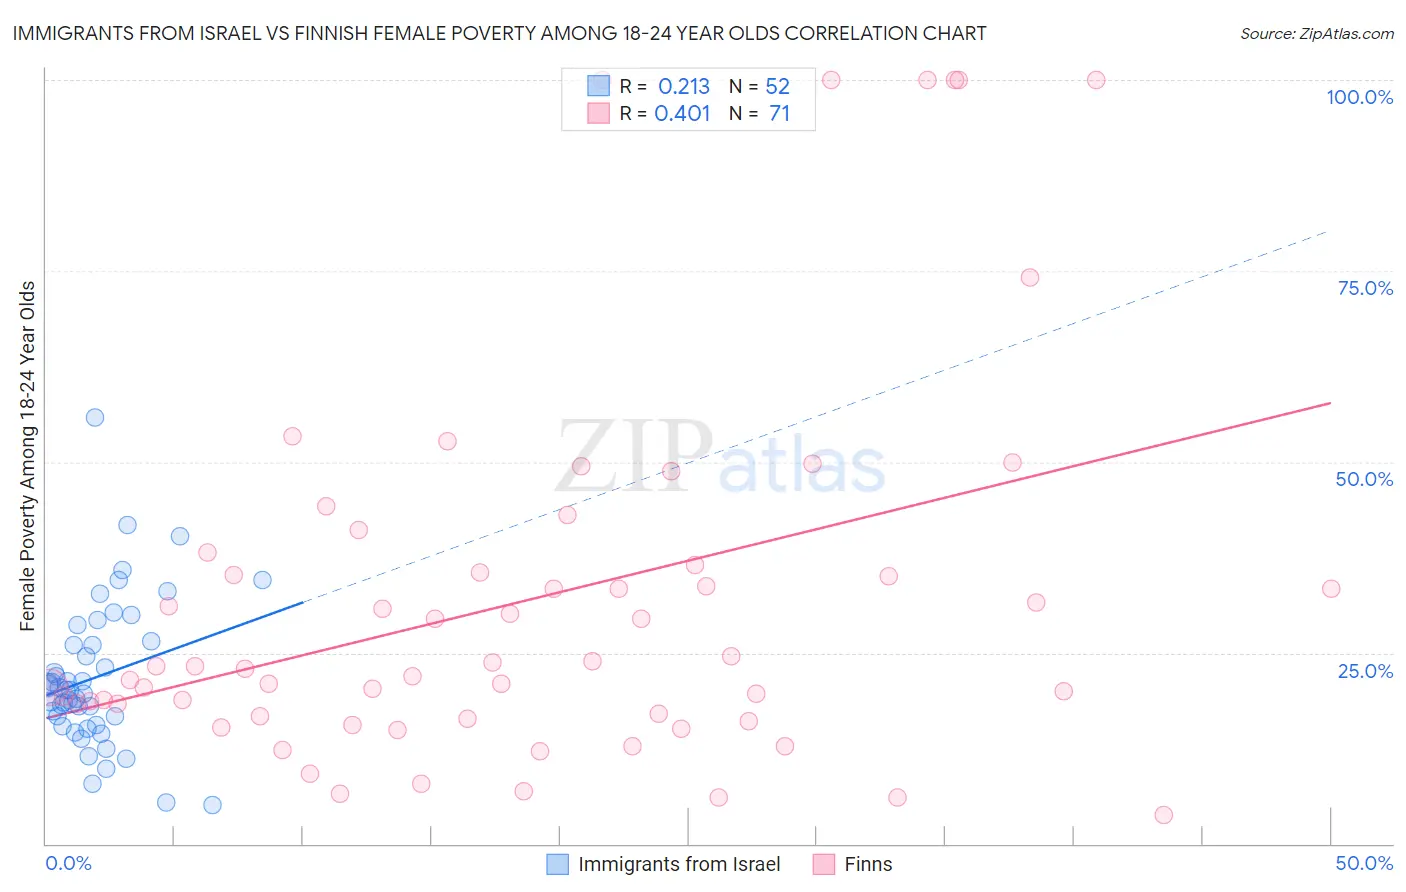
Immigrants from Israel vs Finnish Female Poverty Among 18-24 Year Olds Correlation Chart
The statistical analysis conducted on geographies consisting of 206,741,395 people shows a weak positive correlation between the proportion of Immigrants from Israel and poverty level among females between the ages 18 and 24 in the United States with a correlation coefficient (R) of 0.213 and weighted average of 20.4%. Similarly, the statistical analysis conducted on geographies consisting of 390,891,764 people shows a moderate positive correlation between the proportion of Finns and poverty level among females between the ages 18 and 24 in the United States with a correlation coefficient (R) of 0.401 and weighted average of 20.8%, a difference of 2.0%.
Female Poverty Among 18-24 Year Olds Correlation Summary
| Measurement | Immigrants from Israel | Finnish |
| Minimum | 5.1% | 3.8% |
| Maximum | 55.8% | 100.0% |
| Range | 50.8% | 96.2% |
| Mean | 21.8% | 31.9% |
| Median | 20.2% | 23.2% |
| Interquartile 25% (IQ1) | 16.1% | 16.7% |
| Interquartile 75% (IQ3) | 26.3% | 36.5% |
| Interquartile Range (IQR) | 10.2% | 19.8% |
| Standard Deviation (Sample) | 9.5% | 24.7% |
| Standard Deviation (Population) | 9.4% | 24.6% |
Similar Demographics by Female Poverty Among 18-24 Year Olds
Demographics Similar to Immigrants from Israel by Female Poverty Among 18-24 Year Olds
In terms of female poverty among 18-24 year olds, the demographic groups most similar to Immigrants from Israel are Nigerian (20.4%, a difference of 0.070%), Mexican American Indian (20.4%, a difference of 0.080%), Moroccan (20.4%, a difference of 0.090%), Immigrants from Latvia (20.4%, a difference of 0.10%), and Czech (20.4%, a difference of 0.14%).
| Demographics | Rating | Rank | Female Poverty Among 18-24 Year Olds |
| Nepalese | 39.7 /100 | #185 | Fair 20.2% |
| Immigrants | Ethiopia | 37.3 /100 | #186 | Fair 20.2% |
| Immigrants | Mexico | 36.3 /100 | #187 | Fair 20.2% |
| Scandinavians | 34.6 /100 | #188 | Fair 20.3% |
| Immigrants | Germany | 34.0 /100 | #189 | Fair 20.3% |
| Immigrants | Western Asia | 29.3 /100 | #190 | Fair 20.3% |
| Moroccans | 25.8 /100 | #191 | Fair 20.4% |
| Immigrants | Israel | 24.4 /100 | #192 | Fair 20.4% |
| Nigerians | 23.4 /100 | #193 | Fair 20.4% |
| Mexican American Indians | 23.2 /100 | #194 | Fair 20.4% |
| Immigrants | Latvia | 23.0 /100 | #195 | Fair 20.4% |
| Czechs | 22.3 /100 | #196 | Fair 20.4% |
| Zimbabweans | 21.0 /100 | #197 | Fair 20.4% |
| Immigrants | Spain | 20.7 /100 | #198 | Fair 20.4% |
| Germans | 20.6 /100 | #199 | Fair 20.4% |
Demographics Similar to Finns by Female Poverty Among 18-24 Year Olds
In terms of female poverty among 18-24 year olds, the demographic groups most similar to Finns are Immigrants from St. Vincent and the Grenadines (20.8%, a difference of 0.0%), Australian (20.8%, a difference of 0.030%), White/Caucasian (20.8%, a difference of 0.030%), Immigrants from Denmark (20.8%, a difference of 0.030%), and Ghanaian (20.8%, a difference of 0.10%).
| Demographics | Rating | Rank | Female Poverty Among 18-24 Year Olds |
| Norwegians | 7.3 /100 | #225 | Tragic 20.7% |
| Estonians | 7.2 /100 | #226 | Tragic 20.7% |
| Immigrants | Sweden | 6.8 /100 | #227 | Tragic 20.7% |
| Ghanaians | 6.5 /100 | #228 | Tragic 20.8% |
| Australians | 6.1 /100 | #229 | Tragic 20.8% |
| Whites/Caucasians | 6.1 /100 | #230 | Tragic 20.8% |
| Immigrants | St. Vincent and the Grenadines | 6.0 /100 | #231 | Tragic 20.8% |
| Finns | 6.0 /100 | #232 | Tragic 20.8% |
| Immigrants | Denmark | 5.8 /100 | #233 | Tragic 20.8% |
| Welsh | 5.4 /100 | #234 | Tragic 20.8% |
| Immigrants | Uganda | 5.1 /100 | #235 | Tragic 20.8% |
| Okinawans | 4.9 /100 | #236 | Tragic 20.8% |
| Scottish | 4.5 /100 | #237 | Tragic 20.9% |
| Immigrants | Singapore | 4.4 /100 | #238 | Tragic 20.9% |
| Immigrants | Guatemala | 4.3 /100 | #239 | Tragic 20.9% |