Immigrants from Israel vs Burmese Single Father Poverty
COMPARE
Immigrants from Israel
Burmese
Single Father Poverty
Single Father Poverty Comparison
Immigrants from Israel
Burmese
16.1%
SINGLE FATHER POVERTY
72.0/ 100
METRIC RATING
153rd/ 347
METRIC RANK
15.5%
SINGLE FATHER POVERTY
99.0/ 100
METRIC RATING
88th/ 347
METRIC RANK
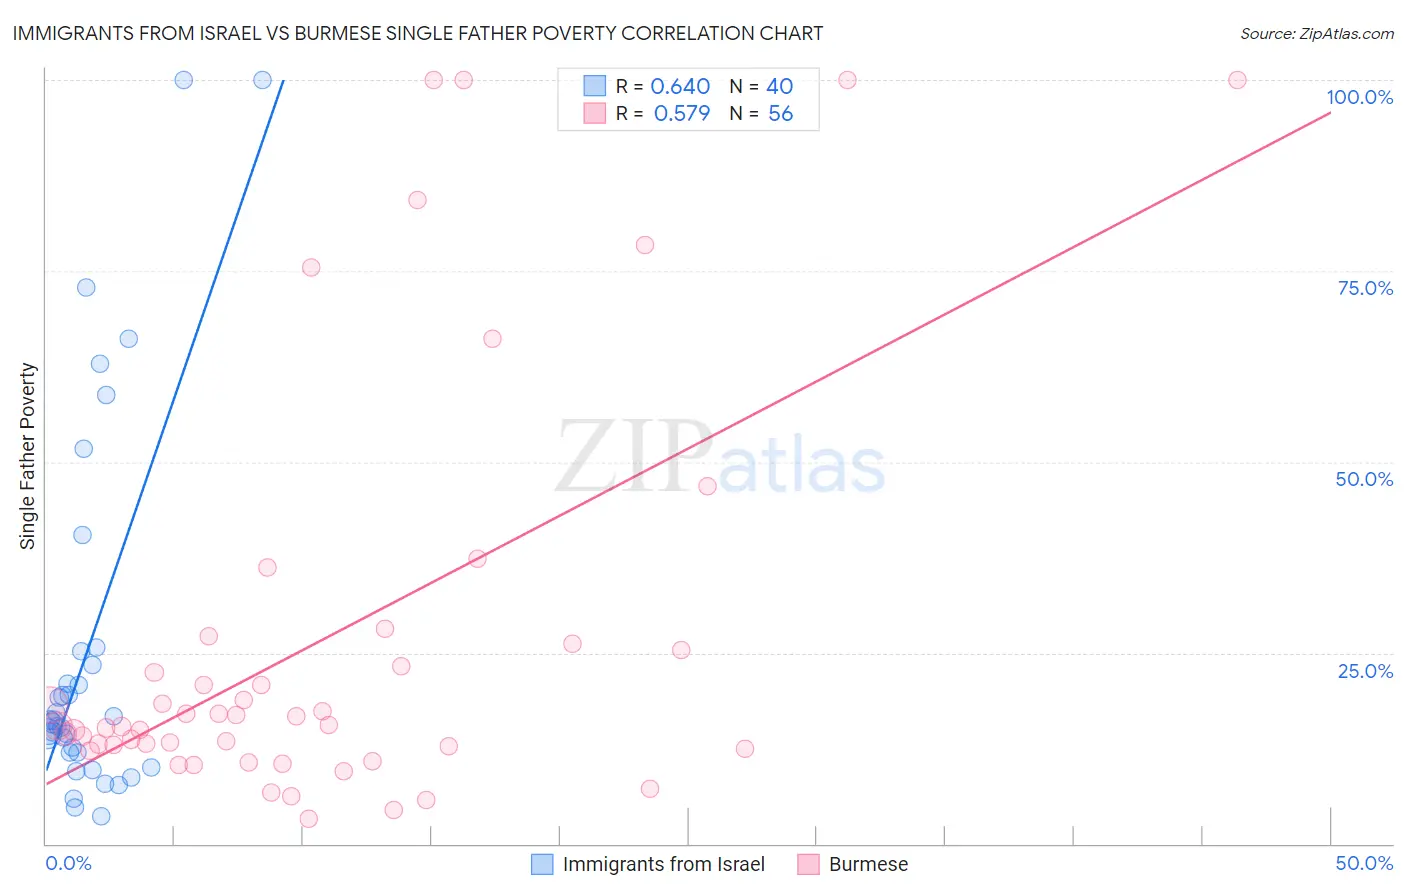
Immigrants from Israel vs Burmese Single Father Poverty Correlation Chart
The statistical analysis conducted on geographies consisting of 172,515,206 people shows a significant positive correlation between the proportion of Immigrants from Israel and poverty level among single fathers in the United States with a correlation coefficient (R) of 0.640 and weighted average of 16.1%. Similarly, the statistical analysis conducted on geographies consisting of 355,001,827 people shows a substantial positive correlation between the proportion of Burmese and poverty level among single fathers in the United States with a correlation coefficient (R) of 0.579 and weighted average of 15.5%, a difference of 4.3%.
Single Father Poverty Correlation Summary
| Measurement | Immigrants from Israel | Burmese |
| Minimum | 3.6% | 3.2% |
| Maximum | 100.0% | 100.0% |
| Range | 96.4% | 96.8% |
| Mean | 25.4% | 26.6% |
| Median | 16.0% | 15.4% |
| Interquartile 25% (IQ1) | 11.9% | 12.7% |
| Interquartile 75% (IQ3) | 24.3% | 25.9% |
| Interquartile Range (IQR) | 12.4% | 13.2% |
| Standard Deviation (Sample) | 24.4% | 26.9% |
| Standard Deviation (Population) | 24.1% | 26.7% |
Similar Demographics by Single Father Poverty
Demographics Similar to Immigrants from Israel by Single Father Poverty
In terms of single father poverty, the demographic groups most similar to Immigrants from Israel are Immigrants from Zimbabwe (16.1%, a difference of 0.0%), Immigrants from France (16.1%, a difference of 0.060%), Mexican (16.1%, a difference of 0.10%), Jordanian (16.1%, a difference of 0.13%), and South African (16.1%, a difference of 0.18%).
| Demographics | Rating | Rank | Single Father Poverty |
| Immigrants | Hungary | 78.3 /100 | #146 | Good 16.1% |
| Colombians | 77.1 /100 | #147 | Good 16.1% |
| Nigerians | 76.8 /100 | #148 | Good 16.1% |
| South Africans | 75.1 /100 | #149 | Good 16.1% |
| Jordanians | 74.2 /100 | #150 | Good 16.1% |
| Immigrants | France | 73.1 /100 | #151 | Good 16.1% |
| Immigrants | Zimbabwe | 72.1 /100 | #152 | Good 16.1% |
| Immigrants | Israel | 72.0 /100 | #153 | Good 16.1% |
| Mexicans | 70.1 /100 | #154 | Good 16.1% |
| Immigrants | Nicaragua | 67.8 /100 | #155 | Good 16.2% |
| Immigrants | Jordan | 66.0 /100 | #156 | Good 16.2% |
| Immigrants | Czechoslovakia | 62.8 /100 | #157 | Good 16.2% |
| Portuguese | 62.3 /100 | #158 | Good 16.2% |
| Belizeans | 59.9 /100 | #159 | Average 16.2% |
| Immigrants | Sudan | 59.8 /100 | #160 | Average 16.2% |
Demographics Similar to Burmese by Single Father Poverty
In terms of single father poverty, the demographic groups most similar to Burmese are Brazilian (15.5%, a difference of 0.030%), Immigrants from Russia (15.5%, a difference of 0.040%), Immigrants from Korea (15.5%, a difference of 0.060%), Immigrants from Oceania (15.4%, a difference of 0.16%), and Peruvian (15.4%, a difference of 0.28%).
| Demographics | Rating | Rank | Single Father Poverty |
| Immigrants | Congo | 99.4 /100 | #81 | Exceptional 15.4% |
| Immigrants | Ukraine | 99.4 /100 | #82 | Exceptional 15.4% |
| Chinese | 99.3 /100 | #83 | Exceptional 15.4% |
| Peruvians | 99.2 /100 | #84 | Exceptional 15.4% |
| Immigrants | Oceania | 99.1 /100 | #85 | Exceptional 15.4% |
| Immigrants | Russia | 99.0 /100 | #86 | Exceptional 15.5% |
| Brazilians | 99.0 /100 | #87 | Exceptional 15.5% |
| Burmese | 99.0 /100 | #88 | Exceptional 15.5% |
| Immigrants | Korea | 99.0 /100 | #89 | Exceptional 15.5% |
| Mexican American Indians | 98.7 /100 | #90 | Exceptional 15.5% |
| Immigrants | Romania | 98.6 /100 | #91 | Exceptional 15.5% |
| Immigrants | Serbia | 98.5 /100 | #92 | Exceptional 15.5% |
| Basques | 98.4 /100 | #93 | Exceptional 15.5% |
| Immigrants | Uruguay | 98.2 /100 | #94 | Exceptional 15.6% |
| Immigrants | Kazakhstan | 98.2 /100 | #95 | Exceptional 15.6% |