Immigrants from Ireland vs Immigrants from Ecuador Female Poverty
COMPARE
Immigrants from Ireland
Immigrants from Ecuador
Female Poverty
Female Poverty Comparison
Immigrants from Ireland
Immigrants from Ecuador
11.0%
FEMALE POVERTY
99.9/ 100
METRIC RATING
6th/ 347
METRIC RANK
15.6%
FEMALE POVERTY
0.1/ 100
METRIC RATING
264th/ 347
METRIC RANK
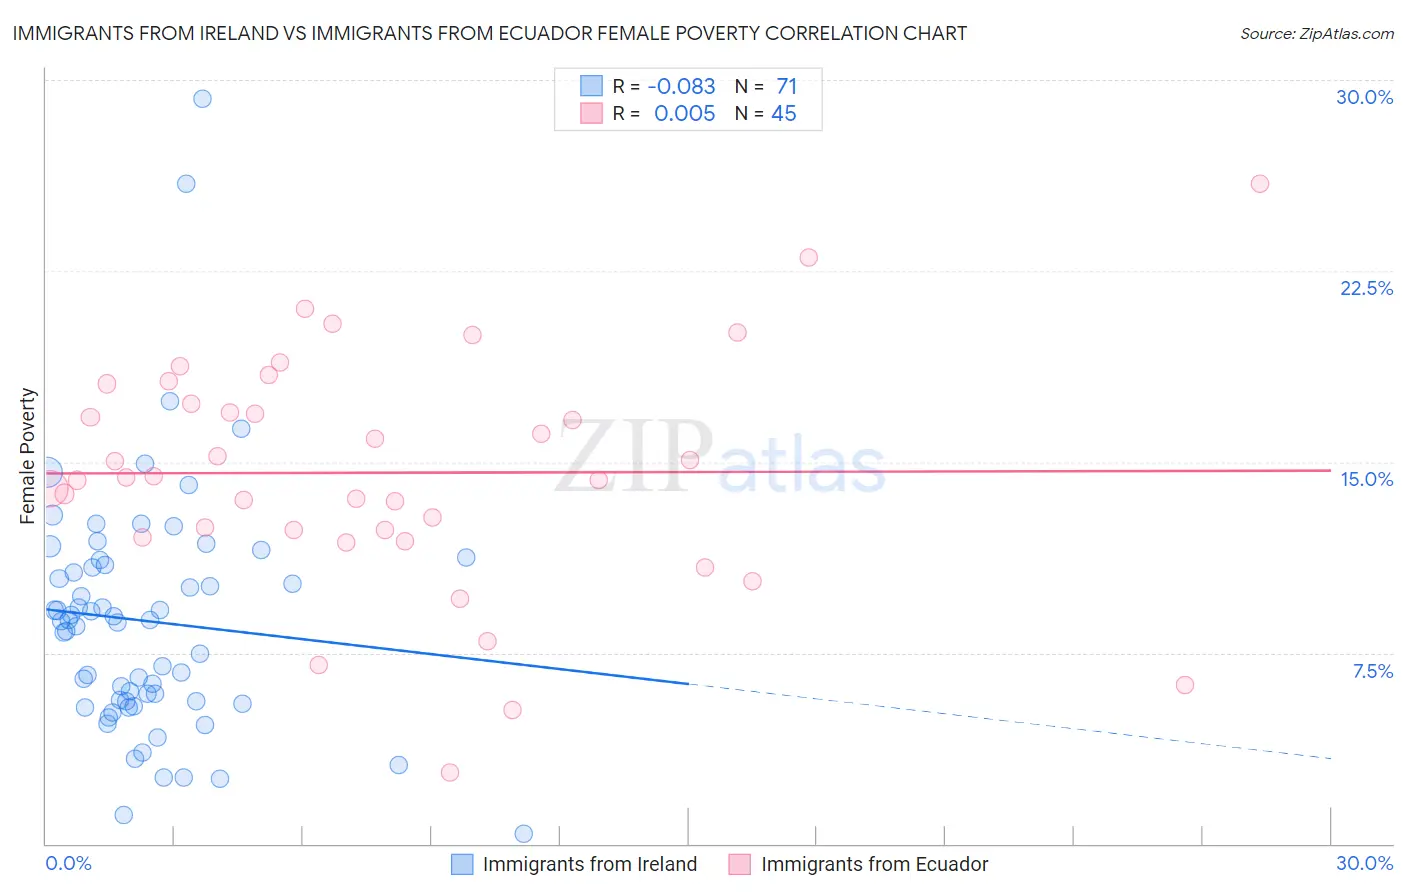
Immigrants from Ireland vs Immigrants from Ecuador Female Poverty Correlation Chart
The statistical analysis conducted on geographies consisting of 240,733,190 people shows a slight negative correlation between the proportion of Immigrants from Ireland and poverty level among females in the United States with a correlation coefficient (R) of -0.083 and weighted average of 11.0%. Similarly, the statistical analysis conducted on geographies consisting of 270,847,702 people shows no correlation between the proportion of Immigrants from Ecuador and poverty level among females in the United States with a correlation coefficient (R) of 0.005 and weighted average of 15.6%, a difference of 42.2%.
Female Poverty Correlation Summary
| Measurement | Immigrants from Ireland | Immigrants from Ecuador |
| Minimum | 0.42% | 2.8% |
| Maximum | 29.3% | 25.9% |
| Range | 28.9% | 23.1% |
| Mean | 8.7% | 14.6% |
| Median | 8.8% | 14.4% |
| Interquartile 25% (IQ1) | 5.6% | 12.2% |
| Interquartile 75% (IQ3) | 10.9% | 17.7% |
| Interquartile Range (IQR) | 5.3% | 5.5% |
| Standard Deviation (Sample) | 4.8% | 4.6% |
| Standard Deviation (Population) | 4.8% | 4.6% |
Similar Demographics by Female Poverty
Demographics Similar to Immigrants from Ireland by Female Poverty
In terms of female poverty, the demographic groups most similar to Immigrants from Ireland are Assyrian/Chaldean/Syriac (11.0%, a difference of 0.37%), Filipino (10.9%, a difference of 0.38%), Immigrants from South Central Asia (11.1%, a difference of 1.1%), Bulgarian (11.1%, a difference of 1.3%), and Immigrants from Hong Kong (11.2%, a difference of 2.1%).
| Demographics | Rating | Rank | Female Poverty |
| Immigrants | India | 100.0 /100 | #1 | Exceptional 9.9% |
| Chinese | 100.0 /100 | #2 | Exceptional 10.4% |
| Thais | 100.0 /100 | #3 | Exceptional 10.5% |
| Immigrants | Taiwan | 100.0 /100 | #4 | Exceptional 10.5% |
| Filipinos | 100.0 /100 | #5 | Exceptional 10.9% |
| Immigrants | Ireland | 99.9 /100 | #6 | Exceptional 11.0% |
| Assyrians/Chaldeans/Syriacs | 99.9 /100 | #7 | Exceptional 11.0% |
| Immigrants | South Central Asia | 99.9 /100 | #8 | Exceptional 11.1% |
| Bulgarians | 99.9 /100 | #9 | Exceptional 11.1% |
| Immigrants | Hong Kong | 99.9 /100 | #10 | Exceptional 11.2% |
| Maltese | 99.9 /100 | #11 | Exceptional 11.2% |
| Bhutanese | 99.9 /100 | #12 | Exceptional 11.3% |
| Immigrants | Lithuania | 99.9 /100 | #13 | Exceptional 11.3% |
| Lithuanians | 99.8 /100 | #14 | Exceptional 11.4% |
| Latvians | 99.8 /100 | #15 | Exceptional 11.4% |
Demographics Similar to Immigrants from Ecuador by Female Poverty
In terms of female poverty, the demographic groups most similar to Immigrants from Ecuador are Cherokee (15.6%, a difference of 0.13%), Guyanese (15.6%, a difference of 0.14%), Mexican American Indian (15.6%, a difference of 0.14%), Immigrants from Guyana (15.6%, a difference of 0.24%), and Immigrants from Liberia (15.7%, a difference of 0.30%).
| Demographics | Rating | Rank | Female Poverty |
| Immigrants | Jamaica | 0.1 /100 | #257 | Tragic 15.6% |
| Shoshone | 0.1 /100 | #258 | Tragic 15.6% |
| Cape Verdeans | 0.1 /100 | #259 | Tragic 15.6% |
| Immigrants | Guyana | 0.1 /100 | #260 | Tragic 15.6% |
| Guyanese | 0.1 /100 | #261 | Tragic 15.6% |
| Mexican American Indians | 0.1 /100 | #262 | Tragic 15.6% |
| Cherokee | 0.1 /100 | #263 | Tragic 15.6% |
| Immigrants | Ecuador | 0.1 /100 | #264 | Tragic 15.6% |
| Immigrants | Liberia | 0.1 /100 | #265 | Tragic 15.7% |
| Immigrants | El Salvador | 0.1 /100 | #266 | Tragic 15.7% |
| Sub-Saharan Africans | 0.1 /100 | #267 | Tragic 15.8% |
| Immigrants | Nicaragua | 0.1 /100 | #268 | Tragic 15.8% |
| Iroquois | 0.1 /100 | #269 | Tragic 15.8% |
| Chickasaw | 0.1 /100 | #270 | Tragic 15.9% |
| Immigrants | St. Vincent and the Grenadines | 0.0 /100 | #271 | Tragic 15.9% |