Immigrants from Ireland vs Immigrants from Bangladesh Seniors Poverty Over the Age of 75
COMPARE
Immigrants from Ireland
Immigrants from Bangladesh
Seniors Poverty Over the Age of 75
Seniors Poverty Over the Age of 75 Comparison
Immigrants from Ireland
Immigrants from Bangladesh
11.9%
SENIORS POVERTY OVER THE AGE OF 75
76.2/ 100
METRIC RATING
135th/ 347
METRIC RANK
15.8%
SENIORS POVERTY OVER THE AGE OF 75
0.0/ 100
METRIC RATING
308th/ 347
METRIC RANK
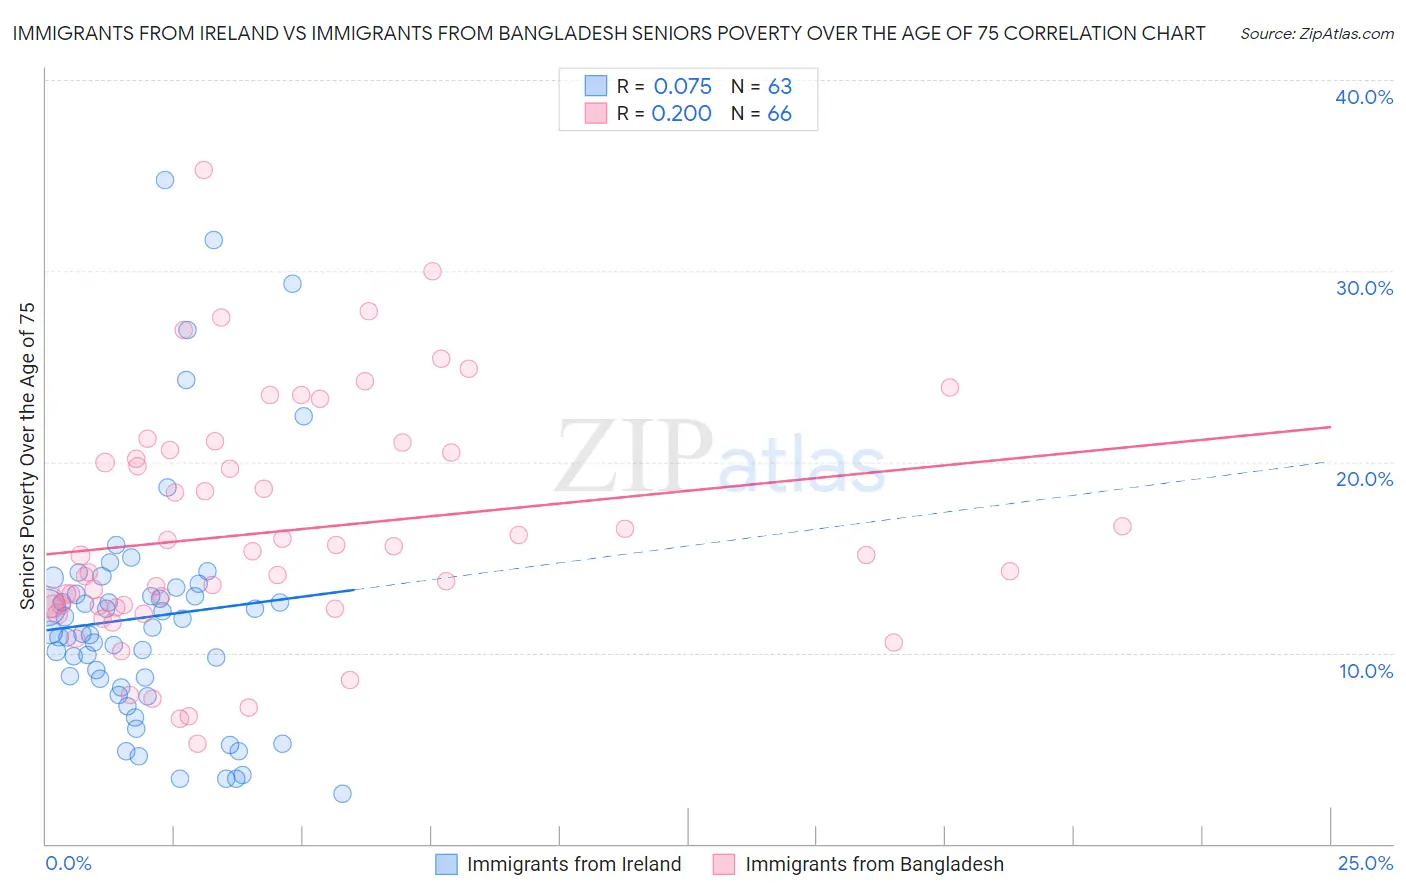
Immigrants from Ireland vs Immigrants from Bangladesh Seniors Poverty Over the Age of 75 Correlation Chart
The statistical analysis conducted on geographies consisting of 239,114,347 people shows a slight positive correlation between the proportion of Immigrants from Ireland and poverty level among seniors over the age of 75 in the United States with a correlation coefficient (R) of 0.075 and weighted average of 11.9%. Similarly, the statistical analysis conducted on geographies consisting of 202,329,238 people shows a weak positive correlation between the proportion of Immigrants from Bangladesh and poverty level among seniors over the age of 75 in the United States with a correlation coefficient (R) of 0.200 and weighted average of 15.8%, a difference of 32.8%.
Seniors Poverty Over the Age of 75 Correlation Summary
| Measurement | Immigrants from Ireland | Immigrants from Bangladesh |
| Minimum | 2.6% | 5.2% |
| Maximum | 34.8% | 35.3% |
| Range | 32.2% | 30.0% |
| Mean | 11.9% | 16.4% |
| Median | 11.1% | 15.1% |
| Interquartile 25% (IQ1) | 8.2% | 12.4% |
| Interquartile 75% (IQ3) | 13.4% | 20.5% |
| Interquartile Range (IQR) | 5.2% | 8.1% |
| Standard Deviation (Sample) | 6.5% | 6.2% |
| Standard Deviation (Population) | 6.5% | 6.1% |
Similar Demographics by Seniors Poverty Over the Age of 75
Demographics Similar to Immigrants from Ireland by Seniors Poverty Over the Age of 75
In terms of seniors poverty over the age of 75, the demographic groups most similar to Immigrants from Ireland are Ugandan (11.9%, a difference of 0.10%), Immigrants from Philippines (11.9%, a difference of 0.14%), Immigrants from Sierra Leone (11.9%, a difference of 0.16%), Immigrants from Moldova (11.9%, a difference of 0.23%), and Lebanese (11.9%, a difference of 0.25%).
| Demographics | Rating | Rank | Seniors Poverty Over the Age of 75 |
| Immigrants | Hungary | 81.7 /100 | #128 | Excellent 11.8% |
| Ethiopians | 80.7 /100 | #129 | Excellent 11.8% |
| Spanish | 80.5 /100 | #130 | Excellent 11.8% |
| Immigrants | Western Europe | 79.6 /100 | #131 | Good 11.9% |
| Lebanese | 78.3 /100 | #132 | Good 11.9% |
| Immigrants | Sierra Leone | 77.6 /100 | #133 | Good 11.9% |
| Ugandans | 77.1 /100 | #134 | Good 11.9% |
| Immigrants | Ireland | 76.2 /100 | #135 | Good 11.9% |
| Immigrants | Philippines | 75.0 /100 | #136 | Good 11.9% |
| Immigrants | Moldova | 74.1 /100 | #137 | Good 11.9% |
| Immigrants | Romania | 72.6 /100 | #138 | Good 11.9% |
| Immigrants | Kenya | 72.6 /100 | #139 | Good 11.9% |
| Immigrants | Pakistan | 71.9 /100 | #140 | Good 12.0% |
| Immigrants | Cameroon | 71.7 /100 | #141 | Good 12.0% |
| Immigrants | Laos | 71.5 /100 | #142 | Good 12.0% |
Demographics Similar to Immigrants from Bangladesh by Seniors Poverty Over the Age of 75
In terms of seniors poverty over the age of 75, the demographic groups most similar to Immigrants from Bangladesh are Immigrants from West Indies (15.8%, a difference of 0.040%), Hispanic or Latino (15.8%, a difference of 0.18%), Yup'ik (15.8%, a difference of 0.30%), Ecuadorian (15.7%, a difference of 0.34%), and Immigrants from Trinidad and Tobago (15.7%, a difference of 0.38%).
| Demographics | Rating | Rank | Seniors Poverty Over the Age of 75 |
| Immigrants | Latin America | 0.0 /100 | #301 | Tragic 15.6% |
| West Indians | 0.0 /100 | #302 | Tragic 15.7% |
| Immigrants | Honduras | 0.0 /100 | #303 | Tragic 15.7% |
| Immigrants | Trinidad and Tobago | 0.0 /100 | #304 | Tragic 15.7% |
| Ecuadorians | 0.0 /100 | #305 | Tragic 15.7% |
| Hispanics or Latinos | 0.0 /100 | #306 | Tragic 15.8% |
| Immigrants | West Indies | 0.0 /100 | #307 | Tragic 15.8% |
| Immigrants | Bangladesh | 0.0 /100 | #308 | Tragic 15.8% |
| Yup'ik | 0.0 /100 | #309 | Tragic 15.8% |
| Vietnamese | 0.0 /100 | #310 | Tragic 15.9% |
| Trinidadians and Tobagonians | 0.0 /100 | #311 | Tragic 15.9% |
| Crow | 0.0 /100 | #312 | Tragic 15.9% |
| Barbadians | 0.0 /100 | #313 | Tragic 16.0% |
| Tsimshian | 0.0 /100 | #314 | Tragic 16.1% |
| Guyanese | 0.0 /100 | #315 | Tragic 16.1% |