Immigrants from Iraq vs Slovak Male Poverty
COMPARE
Immigrants from Iraq
Slovak
Male Poverty
Male Poverty Comparison
Immigrants from Iraq
Slovaks
11.4%
MALE POVERTY
31.9/ 100
METRIC RATING
187th/ 347
METRIC RANK
10.2%
MALE POVERTY
97.7/ 100
METRIC RATING
63rd/ 347
METRIC RANK
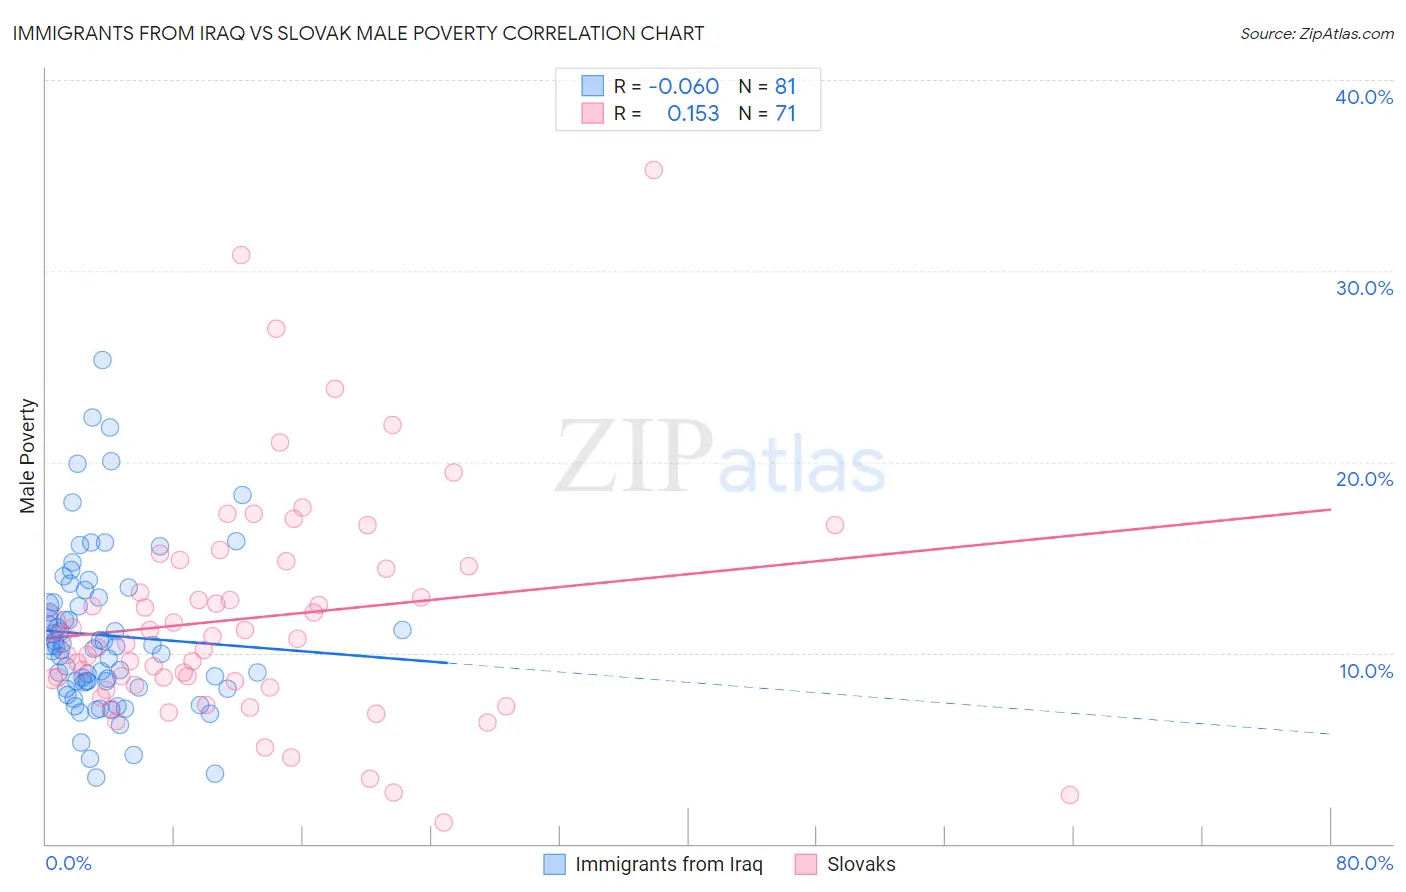
Immigrants from Iraq vs Slovak Male Poverty Correlation Chart
The statistical analysis conducted on geographies consisting of 194,696,024 people shows a slight negative correlation between the proportion of Immigrants from Iraq and poverty level among males in the United States with a correlation coefficient (R) of -0.060 and weighted average of 11.4%. Similarly, the statistical analysis conducted on geographies consisting of 397,408,255 people shows a poor positive correlation between the proportion of Slovaks and poverty level among males in the United States with a correlation coefficient (R) of 0.153 and weighted average of 10.2%, a difference of 12.2%.
Male Poverty Correlation Summary
| Measurement | Immigrants from Iraq | Slovak |
| Minimum | 3.5% | 1.1% |
| Maximum | 25.3% | 35.3% |
| Range | 21.9% | 34.2% |
| Mean | 10.9% | 11.8% |
| Median | 10.3% | 10.7% |
| Interquartile 25% (IQ1) | 8.3% | 8.3% |
| Interquartile 75% (IQ3) | 12.8% | 14.6% |
| Interquartile Range (IQR) | 4.5% | 6.2% |
| Standard Deviation (Sample) | 4.2% | 6.1% |
| Standard Deviation (Population) | 4.2% | 6.0% |
Similar Demographics by Male Poverty
Demographics Similar to Immigrants from Iraq by Male Poverty
In terms of male poverty, the demographic groups most similar to Immigrants from Iraq are Immigrants from Sierra Leone (11.4%, a difference of 0.11%), Immigrants from Afghanistan (11.4%, a difference of 0.16%), Sierra Leonean (11.4%, a difference of 0.22%), Hawaiian (11.4%, a difference of 0.41%), and Immigrants from South America (11.3%, a difference of 0.54%).
| Demographics | Rating | Rank | Male Poverty |
| Immigrants | Morocco | 40.1 /100 | #180 | Average 11.3% |
| Immigrants | Costa Rica | 39.5 /100 | #181 | Fair 11.3% |
| Mongolians | 39.0 /100 | #182 | Fair 11.3% |
| Kenyans | 38.4 /100 | #183 | Fair 11.3% |
| Immigrants | South America | 36.9 /100 | #184 | Fair 11.3% |
| Immigrants | Afghanistan | 33.3 /100 | #185 | Fair 11.4% |
| Immigrants | Sierra Leone | 32.9 /100 | #186 | Fair 11.4% |
| Immigrants | Iraq | 31.9 /100 | #187 | Fair 11.4% |
| Sierra Leoneans | 29.9 /100 | #188 | Fair 11.4% |
| Hawaiians | 28.3 /100 | #189 | Fair 11.4% |
| Israelis | 26.1 /100 | #190 | Fair 11.5% |
| South American Indians | 22.8 /100 | #191 | Fair 11.5% |
| Immigrants | Uruguay | 19.1 /100 | #192 | Poor 11.6% |
| Immigrants | Kuwait | 17.3 /100 | #193 | Poor 11.6% |
| Immigrants | Kenya | 16.1 /100 | #194 | Poor 11.6% |
Demographics Similar to Slovaks by Male Poverty
In terms of male poverty, the demographic groups most similar to Slovaks are Immigrants from Italy (10.2%, a difference of 0.040%), Austrian (10.1%, a difference of 0.13%), Ukrainian (10.1%, a difference of 0.15%), Immigrants from Europe (10.1%, a difference of 0.24%), and Swiss (10.2%, a difference of 0.24%).
| Demographics | Rating | Rank | Male Poverty |
| Immigrants | Bulgaria | 98.2 /100 | #56 | Exceptional 10.1% |
| Estonians | 98.1 /100 | #57 | Exceptional 10.1% |
| Scandinavians | 98.0 /100 | #58 | Exceptional 10.1% |
| Immigrants | Europe | 97.9 /100 | #59 | Exceptional 10.1% |
| Ukrainians | 97.9 /100 | #60 | Exceptional 10.1% |
| Austrians | 97.8 /100 | #61 | Exceptional 10.1% |
| Immigrants | Italy | 97.8 /100 | #62 | Exceptional 10.2% |
| Slovaks | 97.7 /100 | #63 | Exceptional 10.2% |
| Swiss | 97.5 /100 | #64 | Exceptional 10.2% |
| Zimbabweans | 97.5 /100 | #65 | Exceptional 10.2% |
| Serbians | 97.5 /100 | #66 | Exceptional 10.2% |
| Immigrants | Netherlands | 97.3 /100 | #67 | Exceptional 10.2% |
| Immigrants | Sri Lanka | 97.2 /100 | #68 | Exceptional 10.2% |
| Immigrants | Australia | 97.1 /100 | #69 | Exceptional 10.2% |
| Paraguayans | 97.1 /100 | #70 | Exceptional 10.2% |