Immigrants from Iraq vs German Russian Female Poverty Among 25-34 Year Olds
COMPARE
Immigrants from Iraq
German Russian
Female Poverty Among 25-34 Year Olds
Female Poverty Among 25-34 Year Olds Comparison
Immigrants from Iraq
German Russians
13.1%
FEMALE POVERTY AMONG 25-34 YEAR OLDS
83.6/ 100
METRIC RATING
140th/ 347
METRIC RANK
14.9%
FEMALE POVERTY AMONG 25-34 YEAR OLDS
0.8/ 100
METRIC RATING
247th/ 347
METRIC RANK
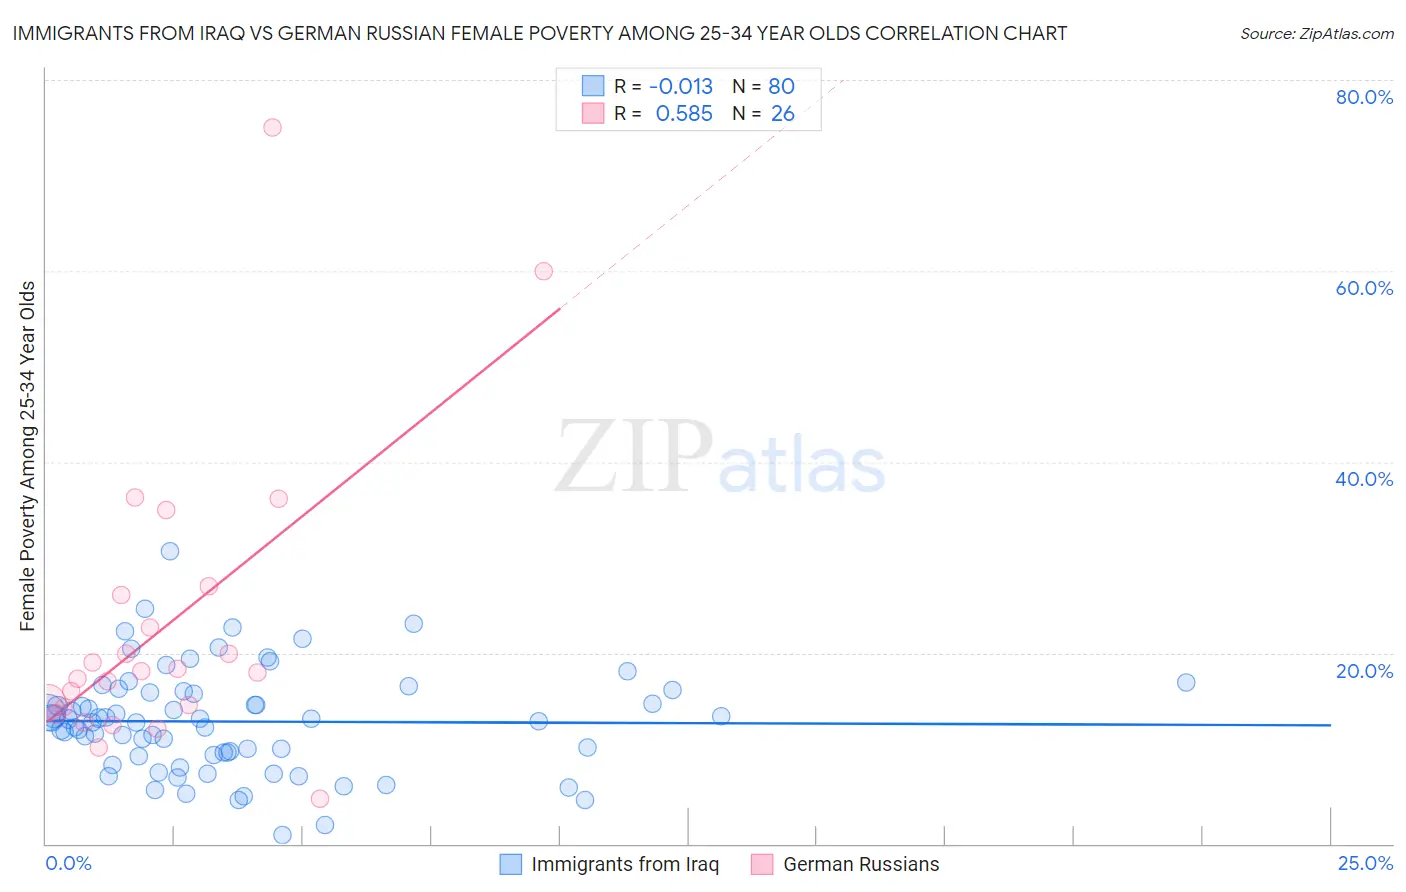
Immigrants from Iraq vs German Russian Female Poverty Among 25-34 Year Olds Correlation Chart
The statistical analysis conducted on geographies consisting of 193,629,527 people shows no correlation between the proportion of Immigrants from Iraq and poverty level among females between the ages 25 and 34 in the United States with a correlation coefficient (R) of -0.013 and weighted average of 13.1%. Similarly, the statistical analysis conducted on geographies consisting of 96,128,428 people shows a substantial positive correlation between the proportion of German Russians and poverty level among females between the ages 25 and 34 in the United States with a correlation coefficient (R) of 0.585 and weighted average of 14.9%, a difference of 13.8%.
Female Poverty Among 25-34 Year Olds Correlation Summary
| Measurement | Immigrants from Iraq | German Russian |
| Minimum | 0.92% | 4.7% |
| Maximum | 30.7% | 75.0% |
| Range | 29.8% | 70.3% |
| Mean | 12.8% | 22.7% |
| Median | 12.9% | 18.0% |
| Interquartile 25% (IQ1) | 9.4% | 14.3% |
| Interquartile 75% (IQ3) | 15.9% | 26.1% |
| Interquartile Range (IQR) | 6.5% | 11.8% |
| Standard Deviation (Sample) | 5.4% | 15.4% |
| Standard Deviation (Population) | 5.4% | 15.1% |
Similar Demographics by Female Poverty Among 25-34 Year Olds
Demographics Similar to Immigrants from Iraq by Female Poverty Among 25-34 Year Olds
In terms of female poverty among 25-34 year olds, the demographic groups most similar to Immigrants from Iraq are Austrian (13.1%, a difference of 0.020%), New Zealander (13.1%, a difference of 0.040%), Brazilian (13.1%, a difference of 0.15%), Immigrants from Chile (13.1%, a difference of 0.16%), and Scandinavian (13.1%, a difference of 0.20%).
| Demographics | Rating | Rank | Female Poverty Among 25-34 Year Olds |
| Serbians | 87.6 /100 | #133 | Excellent 13.0% |
| Afghans | 85.8 /100 | #134 | Excellent 13.0% |
| South Africans | 85.7 /100 | #135 | Excellent 13.0% |
| Immigrants | England | 85.5 /100 | #136 | Excellent 13.0% |
| Immigrants | Chile | 84.6 /100 | #137 | Excellent 13.1% |
| Brazilians | 84.5 /100 | #138 | Excellent 13.1% |
| Austrians | 83.7 /100 | #139 | Excellent 13.1% |
| Immigrants | Iraq | 83.6 /100 | #140 | Excellent 13.1% |
| New Zealanders | 83.4 /100 | #141 | Excellent 13.1% |
| Scandinavians | 82.3 /100 | #142 | Excellent 13.1% |
| Israelis | 81.9 /100 | #143 | Excellent 13.1% |
| Native Hawaiians | 78.9 /100 | #144 | Good 13.2% |
| Colombians | 77.2 /100 | #145 | Good 13.2% |
| South Americans | 76.9 /100 | #146 | Good 13.2% |
| Europeans | 76.8 /100 | #147 | Good 13.2% |
Demographics Similar to German Russians by Female Poverty Among 25-34 Year Olds
In terms of female poverty among 25-34 year olds, the demographic groups most similar to German Russians are Immigrants from Western Africa (14.9%, a difference of 0.040%), Jamaican (14.8%, a difference of 0.34%), Immigrants from Middle Africa (14.8%, a difference of 0.38%), Immigrants from Bangladesh (14.8%, a difference of 0.56%), and Immigrants from Nicaragua (14.8%, a difference of 0.57%).
| Demographics | Rating | Rank | Female Poverty Among 25-34 Year Olds |
| Immigrants | Grenada | 1.3 /100 | #240 | Tragic 14.7% |
| Scotch-Irish | 1.2 /100 | #241 | Tragic 14.8% |
| Barbadians | 1.2 /100 | #242 | Tragic 14.8% |
| Immigrants | Nicaragua | 1.1 /100 | #243 | Tragic 14.8% |
| Immigrants | Bangladesh | 1.1 /100 | #244 | Tragic 14.8% |
| Immigrants | Middle Africa | 1.0 /100 | #245 | Tragic 14.8% |
| Jamaicans | 1.0 /100 | #246 | Tragic 14.8% |
| German Russians | 0.8 /100 | #247 | Tragic 14.9% |
| Immigrants | Western Africa | 0.8 /100 | #248 | Tragic 14.9% |
| Immigrants | Haiti | 0.5 /100 | #249 | Tragic 15.0% |
| Immigrants | El Salvador | 0.5 /100 | #250 | Tragic 15.0% |
| Haitians | 0.5 /100 | #251 | Tragic 15.0% |
| Belizeans | 0.4 /100 | #252 | Tragic 15.1% |
| Immigrants | West Indies | 0.4 /100 | #253 | Tragic 15.1% |
| Somalis | 0.4 /100 | #254 | Tragic 15.1% |