Immigrants from Iran vs Paiute Seniors Poverty Over the Age of 65
COMPARE
Immigrants from Iran
Paiute
Seniors Poverty Over the Age of 65
Seniors Poverty Over the Age of 65 Comparison
Immigrants from Iran
Paiute
10.4%
SENIORS POVERTY OVER THE AGE OF 65
88.4/ 100
METRIC RATING
129th/ 347
METRIC RANK
12.9%
SENIORS POVERTY OVER THE AGE OF 65
0.0/ 100
METRIC RATING
277th/ 347
METRIC RANK
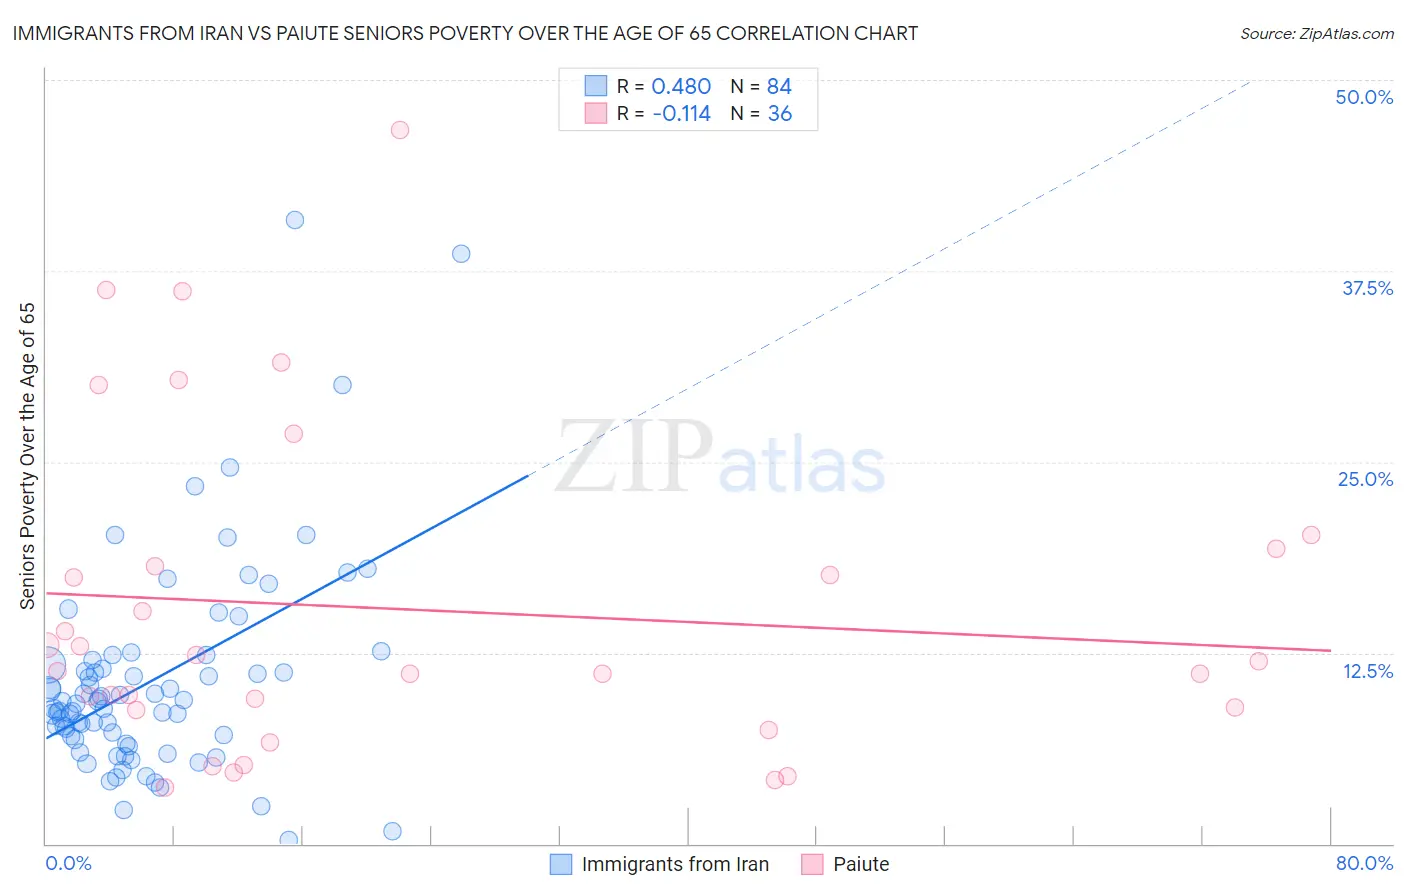
Immigrants from Iran vs Paiute Seniors Poverty Over the Age of 65 Correlation Chart
The statistical analysis conducted on geographies consisting of 279,473,756 people shows a moderate positive correlation between the proportion of Immigrants from Iran and poverty level among seniors over the age of 65 in the United States with a correlation coefficient (R) of 0.480 and weighted average of 10.4%. Similarly, the statistical analysis conducted on geographies consisting of 58,360,776 people shows a poor negative correlation between the proportion of Paiute and poverty level among seniors over the age of 65 in the United States with a correlation coefficient (R) of -0.114 and weighted average of 12.9%, a difference of 23.9%.
Seniors Poverty Over the Age of 65 Correlation Summary
| Measurement | Immigrants from Iran | Paiute |
| Minimum | 0.21% | 3.7% |
| Maximum | 40.9% | 46.8% |
| Range | 40.7% | 43.1% |
| Mean | 10.7% | 15.3% |
| Median | 9.2% | 11.6% |
| Interquartile 25% (IQ1) | 6.9% | 8.8% |
| Interquartile 75% (IQ3) | 11.8% | 18.8% |
| Interquartile Range (IQR) | 4.9% | 9.9% |
| Standard Deviation (Sample) | 6.9% | 10.6% |
| Standard Deviation (Population) | 6.9% | 10.4% |
Similar Demographics by Seniors Poverty Over the Age of 65
Demographics Similar to Immigrants from Iran by Seniors Poverty Over the Age of 65
In terms of seniors poverty over the age of 65, the demographic groups most similar to Immigrants from Iran are Immigrants from Oceania (10.4%, a difference of 0.0%), Ottawa (10.4%, a difference of 0.020%), Immigrants from Hungary (10.4%, a difference of 0.15%), Cambodian (10.4%, a difference of 0.15%), and Egyptian (10.5%, a difference of 0.15%).
| Demographics | Rating | Rank | Seniors Poverty Over the Age of 65 |
| Immigrants | Moldova | 90.7 /100 | #122 | Exceptional 10.4% |
| Hmong | 90.0 /100 | #123 | Exceptional 10.4% |
| Asians | 89.9 /100 | #124 | Excellent 10.4% |
| Immigrants | Philippines | 89.4 /100 | #125 | Excellent 10.4% |
| Immigrants | Hungary | 89.1 /100 | #126 | Excellent 10.4% |
| Cambodians | 89.1 /100 | #127 | Excellent 10.4% |
| Ottawa | 88.5 /100 | #128 | Excellent 10.4% |
| Immigrants | Iran | 88.4 /100 | #129 | Excellent 10.4% |
| Immigrants | Oceania | 88.4 /100 | #130 | Excellent 10.4% |
| Egyptians | 87.8 /100 | #131 | Excellent 10.5% |
| Immigrants | Turkey | 87.7 /100 | #132 | Excellent 10.5% |
| Guamanians/Chamorros | 87.5 /100 | #133 | Excellent 10.5% |
| Sierra Leoneans | 86.8 /100 | #134 | Excellent 10.5% |
| Immigrants | Norway | 86.5 /100 | #135 | Excellent 10.5% |
| Immigrants | Serbia | 86.4 /100 | #136 | Excellent 10.5% |
Demographics Similar to Paiute by Seniors Poverty Over the Age of 65
In terms of seniors poverty over the age of 65, the demographic groups most similar to Paiute are Immigrants from the Azores (12.9%, a difference of 0.090%), Immigrants from Colombia (12.9%, a difference of 0.32%), Immigrants from Bahamas (13.0%, a difference of 0.83%), Mexican (13.1%, a difference of 0.98%), and Salvadoran (12.8%, a difference of 0.99%).
| Demographics | Rating | Rank | Seniors Poverty Over the Age of 65 |
| Immigrants | South America | 0.1 /100 | #270 | Tragic 12.7% |
| Immigrants | Ghana | 0.1 /100 | #271 | Tragic 12.8% |
| Immigrants | Uruguay | 0.1 /100 | #272 | Tragic 12.8% |
| Kiowa | 0.0 /100 | #273 | Tragic 12.8% |
| Salvadorans | 0.0 /100 | #274 | Tragic 12.8% |
| Immigrants | Colombia | 0.0 /100 | #275 | Tragic 12.9% |
| Immigrants | Azores | 0.0 /100 | #276 | Tragic 12.9% |
| Paiute | 0.0 /100 | #277 | Tragic 12.9% |
| Immigrants | Bahamas | 0.0 /100 | #278 | Tragic 13.0% |
| Mexicans | 0.0 /100 | #279 | Tragic 13.1% |
| Yuman | 0.0 /100 | #280 | Tragic 13.1% |
| Immigrants | El Salvador | 0.0 /100 | #281 | Tragic 13.1% |
| Senegalese | 0.0 /100 | #282 | Tragic 13.3% |
| Central Americans | 0.0 /100 | #283 | Tragic 13.4% |
| Colville | 0.0 /100 | #284 | Tragic 13.5% |