Immigrants from Iran vs Native/Alaskan Female Poverty Among 18-24 Year Olds
COMPARE
Immigrants from Iran
Native/Alaskan
Female Poverty Among 18-24 Year Olds
Female Poverty Among 18-24 Year Olds Comparison
Immigrants from Iran
Natives/Alaskans
19.3%
FEMALE POVERTY AMONG 18-24 YEAR OLDS
95.8/ 100
METRIC RATING
117th/ 347
METRIC RANK
25.4%
FEMALE POVERTY AMONG 18-24 YEAR OLDS
0.0/ 100
METRIC RATING
328th/ 347
METRIC RANK
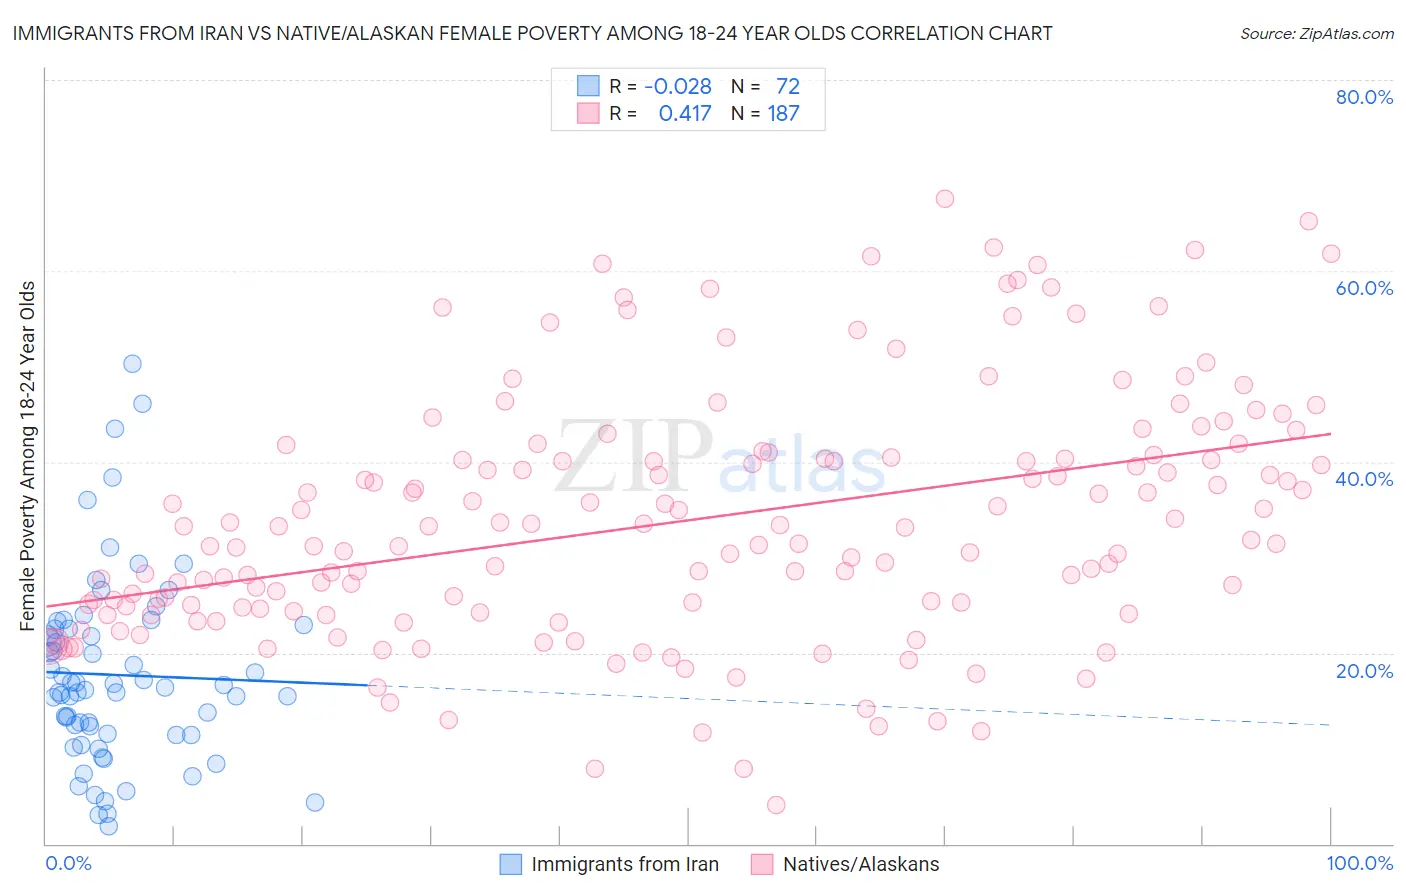
Immigrants from Iran vs Native/Alaskan Female Poverty Among 18-24 Year Olds Correlation Chart
The statistical analysis conducted on geographies consisting of 275,233,640 people shows no correlation between the proportion of Immigrants from Iran and poverty level among females between the ages 18 and 24 in the United States with a correlation coefficient (R) of -0.028 and weighted average of 19.3%. Similarly, the statistical analysis conducted on geographies consisting of 494,517,796 people shows a moderate positive correlation between the proportion of Natives/Alaskans and poverty level among females between the ages 18 and 24 in the United States with a correlation coefficient (R) of 0.417 and weighted average of 25.4%, a difference of 31.5%.
Female Poverty Among 18-24 Year Olds Correlation Summary
| Measurement | Immigrants from Iran | Native/Alaskan |
| Minimum | 1.8% | 4.0% |
| Maximum | 50.2% | 67.6% |
| Range | 48.4% | 63.6% |
| Mean | 17.7% | 33.8% |
| Median | 16.3% | 31.8% |
| Interquartile 25% (IQ1) | 11.5% | 24.6% |
| Interquartile 75% (IQ3) | 22.5% | 40.4% |
| Interquartile Range (IQR) | 11.0% | 15.9% |
| Standard Deviation (Sample) | 9.8% | 12.9% |
| Standard Deviation (Population) | 9.7% | 12.8% |
Similar Demographics by Female Poverty Among 18-24 Year Olds
Demographics Similar to Immigrants from Iran by Female Poverty Among 18-24 Year Olds
In terms of female poverty among 18-24 year olds, the demographic groups most similar to Immigrants from Iran are Immigrants (19.3%, a difference of 0.030%), Immigrants from Guyana (19.3%, a difference of 0.060%), Cypriot (19.3%, a difference of 0.070%), Immigrants from Northern Europe (19.4%, a difference of 0.12%), and Immigrants from Hungary (19.3%, a difference of 0.14%).
| Demographics | Rating | Rank | Female Poverty Among 18-24 Year Olds |
| Laotians | 97.1 /100 | #110 | Exceptional 19.2% |
| Immigrants | Serbia | 97.1 /100 | #111 | Exceptional 19.2% |
| Immigrants | El Salvador | 96.5 /100 | #112 | Exceptional 19.3% |
| Immigrants | Cameroon | 96.3 /100 | #113 | Exceptional 19.3% |
| Slovenes | 96.2 /100 | #114 | Exceptional 19.3% |
| Immigrants | Hungary | 96.2 /100 | #115 | Exceptional 19.3% |
| Immigrants | Immigrants | 95.9 /100 | #116 | Exceptional 19.3% |
| Immigrants | Iran | 95.8 /100 | #117 | Exceptional 19.3% |
| Immigrants | Guyana | 95.6 /100 | #118 | Exceptional 19.3% |
| Cypriots | 95.5 /100 | #119 | Exceptional 19.3% |
| Immigrants | Northern Europe | 95.4 /100 | #120 | Exceptional 19.4% |
| Guyanese | 95.3 /100 | #121 | Exceptional 19.4% |
| Cambodians | 94.6 /100 | #122 | Exceptional 19.4% |
| Paraguayans | 94.6 /100 | #123 | Exceptional 19.4% |
| Immigrants | Chile | 94.3 /100 | #124 | Exceptional 19.4% |
Demographics Similar to Natives/Alaskans by Female Poverty Among 18-24 Year Olds
In terms of female poverty among 18-24 year olds, the demographic groups most similar to Natives/Alaskans are Ute (25.4%, a difference of 0.050%), Yakama (25.3%, a difference of 0.29%), Immigrants from Saudi Arabia (25.3%, a difference of 0.54%), German Russian (25.2%, a difference of 0.97%), and Arapaho (25.2%, a difference of 1.0%).
| Demographics | Rating | Rank | Female Poverty Among 18-24 Year Olds |
| Immigrants | Zaire | 0.0 /100 | #321 | Tragic 25.1% |
| Somalis | 0.0 /100 | #322 | Tragic 25.1% |
| Arapaho | 0.0 /100 | #323 | Tragic 25.2% |
| German Russians | 0.0 /100 | #324 | Tragic 25.2% |
| Immigrants | Saudi Arabia | 0.0 /100 | #325 | Tragic 25.3% |
| Yakama | 0.0 /100 | #326 | Tragic 25.3% |
| Ute | 0.0 /100 | #327 | Tragic 25.4% |
| Natives/Alaskans | 0.0 /100 | #328 | Tragic 25.4% |
| Cajuns | 0.0 /100 | #329 | Tragic 25.7% |
| Immigrants | Somalia | 0.0 /100 | #330 | Tragic 25.7% |
| Chippewa | 0.0 /100 | #331 | Tragic 25.9% |
| Houma | 0.0 /100 | #332 | Tragic 26.2% |
| Apache | 0.0 /100 | #333 | Tragic 26.3% |
| Pueblo | 0.0 /100 | #334 | Tragic 26.9% |
| Yup'ik | 0.0 /100 | #335 | Tragic 27.0% |