Immigrants from Indonesia vs Immigrants from Northern Europe Child Poverty Under the Age of 16

COMPARE

Immigrants from Indonesia
Race
Ancestry
AfghanAfricanAlaska NativeAlaskan AthabascanAlbanianAleutAlsatianAmericanApacheArabArapahoArgentineanArmenianAssyrian/Chaldean/SyriacAustralianAustrianBahamianBangladeshiBarbadianBasqueBelgianBelizeanBermudanBhutaneseBlackfeetBolivianBrazilianBritishBritish West IndianBulgarianBurmeseCajunCambodianCanadianCape VerdeanCarpatho RusynCelticCentral AmericanCentral American IndianCherokeeCheyenneChickasawChileanChineseChippewaChoctawColombianColvilleComancheCosta RicanCreeCreekCroatianCrowCubanCypriotCzechCzechoslovakianDanishDelawareDominicanDutchDutch West IndianEastern EuropeanEcuadorianEgyptianEnglishEstonianEthiopianEuropeanFijianFilipinoFinnishFrenchFrench American IndianFrench CanadianGermanGerman RussianGhanaianGreekGuamanian/ChamorroGuatemalanGuyaneseHaitianHmongHonduranHopiHoumaHungarianIcelanderIndian (Asian)IndonesianInupiatIranianIraqiIrishIroquoisIsraeliItalianJamaicanJapaneseJordanianKenyanKiowaKoreanLaotianLatvianLebaneseLiberianLithuanianLumbeeLuxembourgerMacedonianMalaysianMalteseMarshalleseMenomineeMexicanMexican American IndianMongolianMoroccanNative HawaiianNavajoNepaleseNew ZealanderNicaraguanNigerianNorthern EuropeanNorwegianOkinawanOsageOttawaPaiutePakistaniPalestinianPanamanianParaguayanPennsylvania GermanPeruvianPimaPolishPortuguesePotawatomiPuebloPuerto RicanPuget Sound SalishRomanianRussianSalvadoranSamoanScandinavianScotch-IrishScottishSeminoleSenegaleseSerbianShoshoneSierra LeoneanSiouxSlavicSlovakSloveneSomaliSouth AfricanSouth AmericanSouth American IndianSoviet UnionSpaniardSpanishSpanish AmericanSpanish American IndianSri LankanSubsaharan AfricanSudaneseSwedishSwissSyrianTaiwaneseThaiTlingit-HaidaTohono O'OdhamTonganTrinidadian and TobagonianTsimshianTurkishU.S. Virgin IslanderUgandanUkrainianUruguayanUteVenezuelanVietnameseWelshWest IndianYakamaYaquiYugoslavianYumanYup'ikZimbabwean
Immigration
NonimmigrantsImmigrantsAfghanistanAfricaAlbaniaArgentinaArmeniaAsiaAustraliaAustriaBahamasBangladeshBarbadosBelarusBelgiumBelizeBoliviaBosnia and HerzegovinaBrazilBulgariaBurma/MyanmarCabo VerdeCambodiaCameroonCanadaCaribbeanCentral AmericaChileChinaColombiaCongoCosta RicaCroatiaCubaCzechoslovakiaDenmarkDominicaDominican RepublicEastern AfricaEastern AsiaEastern EuropeEcuadorEgyptEl SalvadorEnglandEritreaEthiopiaEuropeFijiFranceGermanyGhanaGreeceGrenadaGuatemalaGuyanaHaitiHondurasHong KongHungaryIndiaIndonesiaIranIraqIrelandIsraelItalyJamaicaJapanJordanKazakhstanKenyaKoreaKuwaitLaosLatin AmericaLatviaLebanonLiberiaLithuaniaMalaysiaMexicoMicronesiaMiddle AfricaMoldovaMoroccoNepalNetherlandsNicaraguaNigeriaNorth AmericaNorth MacedoniaNorthern AfricaNorwayOceaniaPakistanPanamaPeruPhilippinesPolandPortugalRomaniaRussiaSaudi ArabiaScotlandSenegalSerbiaSierra LeoneSingaporeSomaliaSouth AfricaSouth AmericaSouth Central AsiaSouth Eastern AsiaSouthern EuropeSpainSri LankaSt. Vincent and the GrenadinesSudanSwedenSwitzerlandSyriaTaiwanThailandTrinidad and TobagoTurkeyUgandaUkraineUruguayUzbekistanVenezuelaVietnamWest IndiesWestern AfricaWestern AsiaWestern EuropeYemenZaireZimbabweAzores
Immigrants from Northern Europe
Race
Ancestry
AfghanAfricanAlaska NativeAlaskan AthabascanAlbanianAleutAlsatianAmericanApacheArabArapahoArgentineanArmenianAssyrian/Chaldean/SyriacAustralianAustrianBahamianBangladeshiBarbadianBasqueBelgianBelizeanBermudanBhutaneseBlackfeetBolivianBrazilianBritishBritish West IndianBulgarianBurmeseCajunCambodianCanadianCape VerdeanCarpatho RusynCelticCentral AmericanCentral American IndianCherokeeCheyenneChickasawChileanChineseChippewaChoctawColombianColvilleComancheCosta RicanCreeCreekCroatianCrowCubanCypriotCzechCzechoslovakianDanishDelawareDominicanDutchDutch West IndianEastern EuropeanEcuadorianEgyptianEnglishEstonianEthiopianEuropeanFijianFilipinoFinnishFrenchFrench American IndianFrench CanadianGermanGerman RussianGhanaianGreekGuamanian/ChamorroGuatemalanGuyaneseHaitianHmongHonduranHopiHoumaHungarianIcelanderIndian (Asian)IndonesianInupiatIranianIraqiIrishIroquoisIsraeliItalianJamaicanJapaneseJordanianKenyanKiowaKoreanLaotianLatvianLebaneseLiberianLithuanianLumbeeLuxembourgerMacedonianMalaysianMalteseMarshalleseMenomineeMexicanMexican American IndianMongolianMoroccanNative HawaiianNavajoNepaleseNew ZealanderNicaraguanNigerianNorthern EuropeanNorwegianOkinawanOsageOttawaPaiutePakistaniPalestinianPanamanianParaguayanPennsylvania GermanPeruvianPimaPolishPortuguesePotawatomiPuebloPuerto RicanPuget Sound SalishRomanianRussianSalvadoranSamoanScandinavianScotch-IrishScottishSeminoleSenegaleseSerbianShoshoneSierra LeoneanSiouxSlavicSlovakSloveneSomaliSouth AfricanSouth AmericanSouth American IndianSoviet UnionSpaniardSpanishSpanish AmericanSpanish American IndianSri LankanSubsaharan AfricanSudaneseSwedishSwissSyrianTaiwaneseThaiTlingit-HaidaTohono O'OdhamTonganTrinidadian and TobagonianTsimshianTurkishU.S. Virgin IslanderUgandanUkrainianUruguayanUteVenezuelanVietnameseWelshWest IndianYakamaYaquiYugoslavianYumanYup'ikZimbabwean
Immigration
NonimmigrantsImmigrantsAfghanistanAfricaAlbaniaArgentinaArmeniaAsiaAustraliaAustriaBahamasBangladeshBarbadosBelarusBelgiumBelizeBoliviaBosnia and HerzegovinaBrazilBulgariaBurma/MyanmarCabo VerdeCambodiaCameroonCanadaCaribbeanCentral AmericaChileChinaColombiaCongoCosta RicaCroatiaCubaCzechoslovakiaDenmarkDominicaDominican RepublicEastern AfricaEastern AsiaEastern EuropeEcuadorEgyptEl SalvadorEnglandEritreaEthiopiaEuropeFijiFranceGermanyGhanaGreeceGrenadaGuatemalaGuyanaHaitiHondurasHong KongHungaryIndiaIranIraqIrelandIsraelItalyJamaicaJapanJordanKazakhstanKenyaKoreaKuwaitLaosLatin AmericaLatviaLebanonLiberiaLithuaniaMalaysiaMexicoMicronesiaMiddle AfricaMoldovaMoroccoNepalNetherlandsNicaraguaNigeriaNorth AmericaNorth MacedoniaNorthern AfricaNorthern EuropeNorwayOceaniaPakistanPanamaPeruPhilippinesPolandPortugalRomaniaRussiaSaudi ArabiaScotlandSenegalSerbiaSierra LeoneSingaporeSomaliaSouth AfricaSouth AmericaSouth Central AsiaSouth Eastern AsiaSouthern EuropeSpainSri LankaSt. Vincent and the GrenadinesSudanSwedenSwitzerlandSyriaTaiwanThailandTrinidad and TobagoTurkeyUgandaUkraineUruguayUzbekistanVenezuelaVietnamWest IndiesWestern AfricaWestern AsiaWestern EuropeYemenZaireZimbabweAzores
Child Poverty Under the Age of 16
Income
Poverty
Unemployment
Labor Participation
Family Structure
Vehicle Availability
Education Level
Disability

Child Poverty Under the Age of 16 Comparison

Immigrants from Indonesia

Immigrants from Northern Europe

Exceptional
Exceptional
14.1%
CHILD POVERTY UNDER THE AGE OF 16
98.7/ 100
METRIC RATING
55th/ 347
METRIC RANK
13.6%
CHILD POVERTY UNDER THE AGE OF 16
99.6/ 100
METRIC RATING
36th/ 347
METRIC RANK

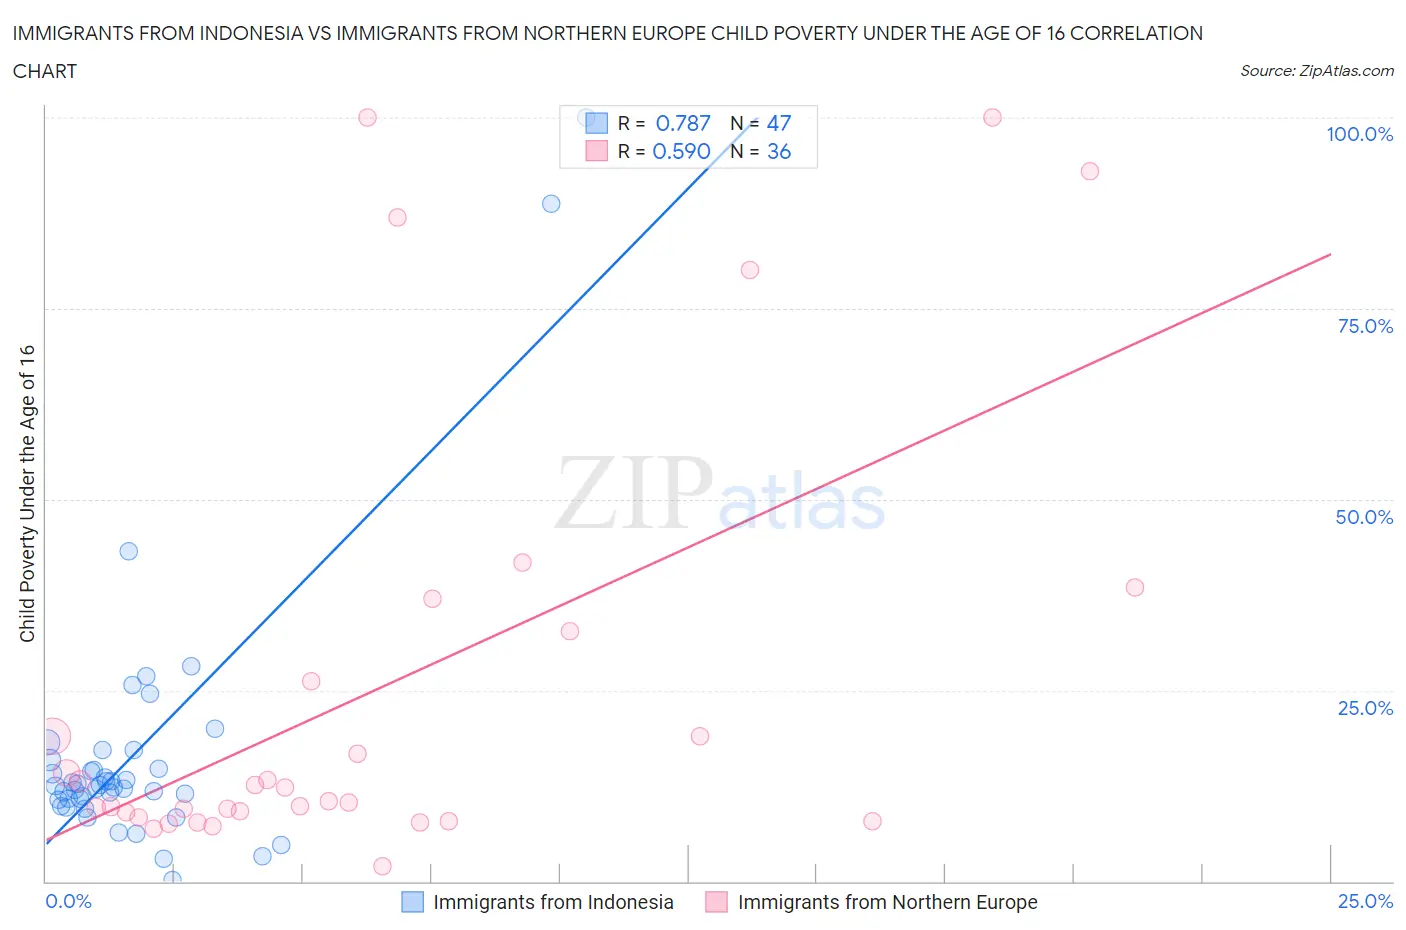
Immigrants from Indonesia vs Immigrants from Northern Europe Child Poverty Under the Age of 16 Correlation Chart

The statistical analysis conducted on geographies consisting of 214,848,631 people shows a strong positive correlation between the proportion of Immigrants from Indonesia and poverty level among children under the age of 16 in the United States with a correlation coefficient (R) of 0.787 and weighted average of 14.1%. Similarly, the statistical analysis conducted on geographies consisting of 470,069,037 people shows a substantial positive correlation between the proportion of Immigrants from Northern Europe and poverty level among children under the age of 16 in the United States with a correlation coefficient (R) of 0.590 and weighted average of 13.6%, a difference of 3.9%.
Immigrants from Indonesia vs Immigrants from Northern Europe Child Poverty Under the Age of 16

Child Poverty Under the Age of 16 Correlation Summary

MeasurementImmigrants from IndonesiaImmigrants from Northern Europe
Minimum0.17%2.0%
Maximum100.0%100.0%
Range99.8%98.0%
Mean16.9%25.2%
Median12.4%11.4%
Interquartile 25% (IQ1)10.7%8.7%
Interquartile 75% (IQ3)15.8%29.4%
Interquartile Range (IQR)5.2%20.7%
Standard Deviation (Sample)18.0%28.9%
Standard Deviation (Population)17.8%28.5%

Demographics Similar to Immigrants from Indonesia and Immigrants from Northern Europe by Child Poverty Under the Age of 16

In terms of child poverty under the age of 16, the demographic groups most similar to Immigrants from Indonesia are Tsimshian (14.1%, a difference of 0.070%), Immigrants from Israel (14.1%, a difference of 0.090%), Polish (14.0%, a difference of 0.40%), Immigrants from Greece (13.9%, a difference of 1.2%), and Immigrants from Czechoslovakia (13.9%, a difference of 1.3%). Similarly, the demographic groups most similar to Immigrants from Northern Europe are Immigrants from Bolivia (13.6%, a difference of 0.010%), Lithuanian (13.5%, a difference of 0.24%), Luxembourger (13.6%, a difference of 0.52%), Immigrants from Australia (13.6%, a difference of 0.55%), and Immigrants from Scotland (13.7%, a difference of 1.2%).
DemographicsRating | RankChild Poverty Under the Age of 16
Lithuanians
99.6
/100
|
#35
Exceptional
13.5%
Immigrants | Northern Europe
99.6
/100
|
#36
Exceptional
13.6%
Immigrants | Bolivia
99.6
/100
|
#37
Exceptional
13.6%
Luxembourgers
99.5
/100
|
#38
Exceptional
13.6%
Immigrants | Australia
99.5
/100
|
#39
Exceptional
13.6%
Immigrants | Scotland
99.4
/100
|
#40
Exceptional
13.7%
Croatians
99.4
/100
|
#41
Exceptional
13.8%
Immigrants | Sri Lanka
99.3
/100
|
#42
Exceptional
13.8%
Immigrants | Moldova
99.3
/100
|
#43
Exceptional
13.8%
Greeks
99.3
/100
|
#44
Exceptional
13.8%
Czechs
99.3
/100
|
#45
Exceptional
13.8%
Immigrants | Asia
99.2
/100
|
#46
Exceptional
13.8%
Estonians
99.2
/100
|
#47
Exceptional
13.9%
Koreans
99.2
/100
|
#48
Exceptional
13.9%
Italians
99.2
/100
|
#49
Exceptional
13.9%
Immigrants | Czechoslovakia
99.1
/100
|
#50
Exceptional
13.9%
Immigrants | Greece
99.1
/100
|
#51
Exceptional
13.9%
Poles
98.9
/100
|
#52
Exceptional
14.0%
Immigrants | Israel
98.8
/100
|
#53
Exceptional
14.1%
Tsimshian
98.8
/100
|
#54
Exceptional
14.1%
Immigrants | Indonesia
98.7
/100
|
#55
Exceptional
14.1%