Immigrants from Indonesia vs Immigrants from Congo Seniors Poverty Over the Age of 65
COMPARE
Immigrants from Indonesia
Immigrants from Congo
Seniors Poverty Over the Age of 65
Seniors Poverty Over the Age of 65 Comparison
Immigrants from Indonesia
Immigrants from Congo
10.8%
SENIORS POVERTY OVER THE AGE OF 65
64.8/ 100
METRIC RATING
162nd/ 347
METRIC RANK
11.7%
SENIORS POVERTY OVER THE AGE OF 65
3.8/ 100
METRIC RATING
223rd/ 347
METRIC RANK
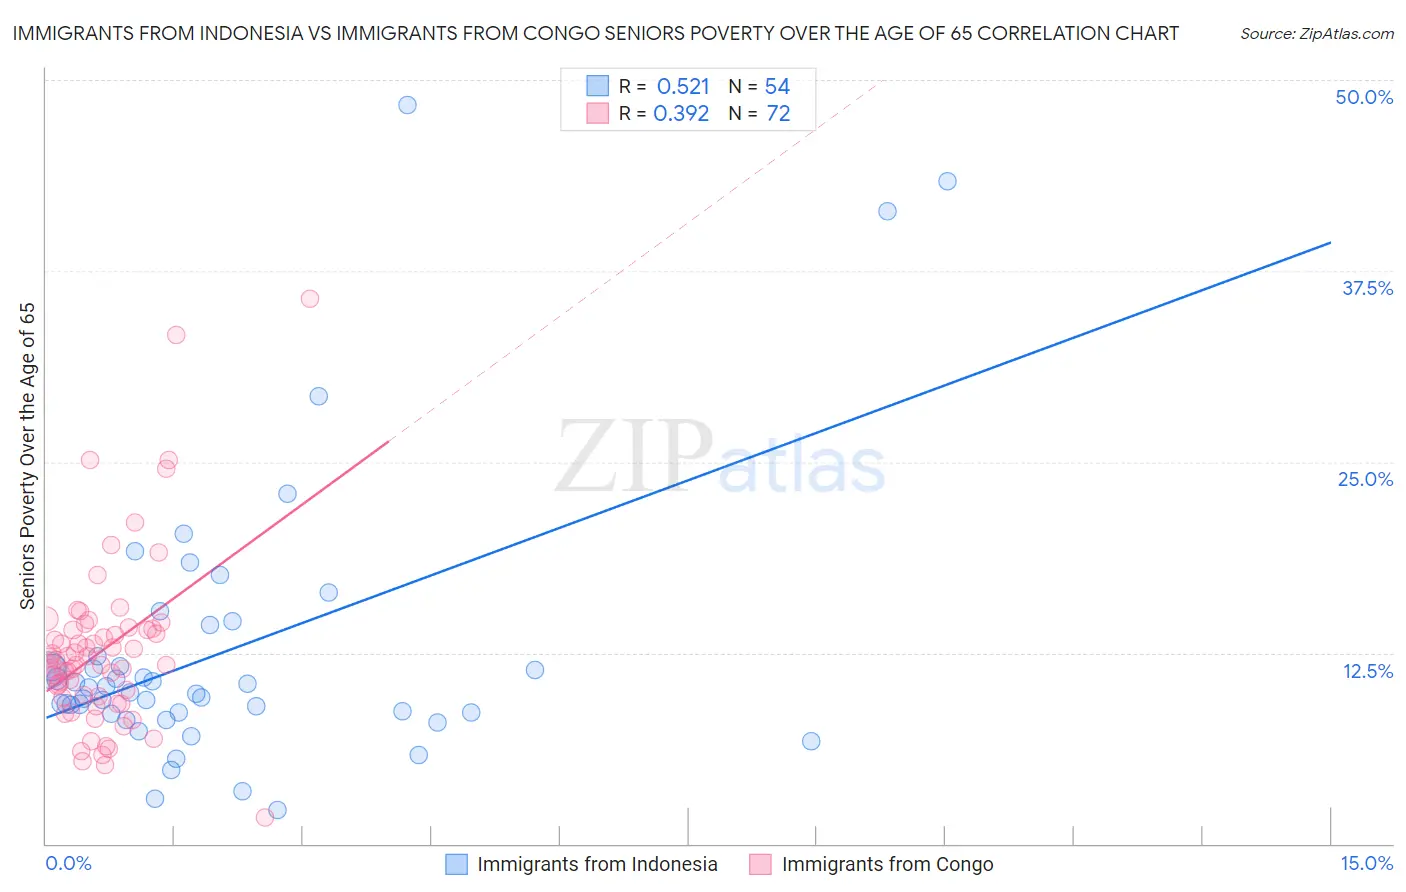
Immigrants from Indonesia vs Immigrants from Congo Seniors Poverty Over the Age of 65 Correlation Chart
The statistical analysis conducted on geographies consisting of 215,406,593 people shows a substantial positive correlation between the proportion of Immigrants from Indonesia and poverty level among seniors over the age of 65 in the United States with a correlation coefficient (R) of 0.521 and weighted average of 10.8%. Similarly, the statistical analysis conducted on geographies consisting of 92,025,514 people shows a mild positive correlation between the proportion of Immigrants from Congo and poverty level among seniors over the age of 65 in the United States with a correlation coefficient (R) of 0.392 and weighted average of 11.7%, a difference of 8.7%.
Seniors Poverty Over the Age of 65 Correlation Summary
| Measurement | Immigrants from Indonesia | Immigrants from Congo |
| Minimum | 2.2% | 1.7% |
| Maximum | 48.3% | 35.7% |
| Range | 46.1% | 34.0% |
| Mean | 12.7% | 12.7% |
| Median | 10.1% | 11.9% |
| Interquartile 25% (IQ1) | 8.6% | 9.6% |
| Interquartile 75% (IQ3) | 12.3% | 14.0% |
| Interquartile Range (IQR) | 3.7% | 4.4% |
| Standard Deviation (Sample) | 9.2% | 5.7% |
| Standard Deviation (Population) | 9.1% | 5.7% |
Similar Demographics by Seniors Poverty Over the Age of 65
Demographics Similar to Immigrants from Indonesia by Seniors Poverty Over the Age of 65
In terms of seniors poverty over the age of 65, the demographic groups most similar to Immigrants from Indonesia are Tsimshian (10.8%, a difference of 0.030%), Arab (10.8%, a difference of 0.040%), Potawatomi (10.8%, a difference of 0.22%), Immigrants from South Eastern Asia (10.8%, a difference of 0.27%), and Malaysian (10.8%, a difference of 0.27%).
| Demographics | Rating | Rank | Seniors Poverty Over the Age of 65 |
| Chickasaw | 73.6 /100 | #155 | Good 10.7% |
| Ethiopians | 72.9 /100 | #156 | Good 10.7% |
| Immigrants | Ethiopia | 72.9 /100 | #157 | Good 10.7% |
| Immigrants | Sierra Leone | 71.7 /100 | #158 | Good 10.7% |
| Immigrants | Micronesia | 70.8 /100 | #159 | Good 10.7% |
| Sudanese | 68.2 /100 | #160 | Good 10.7% |
| Arabs | 65.2 /100 | #161 | Good 10.8% |
| Immigrants | Indonesia | 64.8 /100 | #162 | Good 10.8% |
| Tsimshian | 64.5 /100 | #163 | Good 10.8% |
| Potawatomi | 62.6 /100 | #164 | Good 10.8% |
| Immigrants | South Eastern Asia | 62.1 /100 | #165 | Good 10.8% |
| Malaysians | 62.0 /100 | #166 | Good 10.8% |
| Alaska Natives | 60.3 /100 | #167 | Good 10.8% |
| Mongolians | 58.0 /100 | #168 | Average 10.9% |
| Sri Lankans | 56.8 /100 | #169 | Average 10.9% |
Demographics Similar to Immigrants from Congo by Seniors Poverty Over the Age of 65
In terms of seniors poverty over the age of 65, the demographic groups most similar to Immigrants from Congo are Immigrants from Chile (11.7%, a difference of 0.040%), Argentinean (11.7%, a difference of 0.15%), Peruvian (11.7%, a difference of 0.22%), Immigrants from Nigeria (11.7%, a difference of 0.24%), and Immigrants from Belarus (11.8%, a difference of 0.34%).
| Demographics | Rating | Rank | Seniors Poverty Over the Age of 65 |
| Immigrants | Morocco | 6.8 /100 | #216 | Tragic 11.6% |
| Immigrants | Africa | 6.4 /100 | #217 | Tragic 11.6% |
| Immigrants | Ukraine | 5.7 /100 | #218 | Tragic 11.6% |
| Arapaho | 5.2 /100 | #219 | Tragic 11.6% |
| Peruvians | 4.2 /100 | #220 | Tragic 11.7% |
| Argentineans | 4.1 /100 | #221 | Tragic 11.7% |
| Immigrants | Chile | 3.9 /100 | #222 | Tragic 11.7% |
| Immigrants | Congo | 3.8 /100 | #223 | Tragic 11.7% |
| Immigrants | Nigeria | 3.4 /100 | #224 | Tragic 11.7% |
| Immigrants | Belarus | 3.2 /100 | #225 | Tragic 11.8% |
| Liberians | 3.2 /100 | #226 | Tragic 11.8% |
| Nigerians | 3.2 /100 | #227 | Tragic 11.8% |
| Immigrants | Costa Rica | 2.7 /100 | #228 | Tragic 11.8% |
| Immigrants | Eritrea | 2.6 /100 | #229 | Tragic 11.8% |
| Bermudans | 2.1 /100 | #230 | Tragic 11.9% |