Immigrants from India vs Okinawan Child Poverty Under the Age of 16
COMPARE
Immigrants from India
Okinawan
Child Poverty Under the Age of 16
Child Poverty Under the Age of 16 Comparison
Immigrants from India
Okinawans
10.8%
CHILD POVERTY UNDER THE AGE OF 16
100.0/ 100
METRIC RATING
1st/ 347
METRIC RANK
13.1%
CHILD POVERTY UNDER THE AGE OF 16
99.8/ 100
METRIC RATING
20th/ 347
METRIC RANK
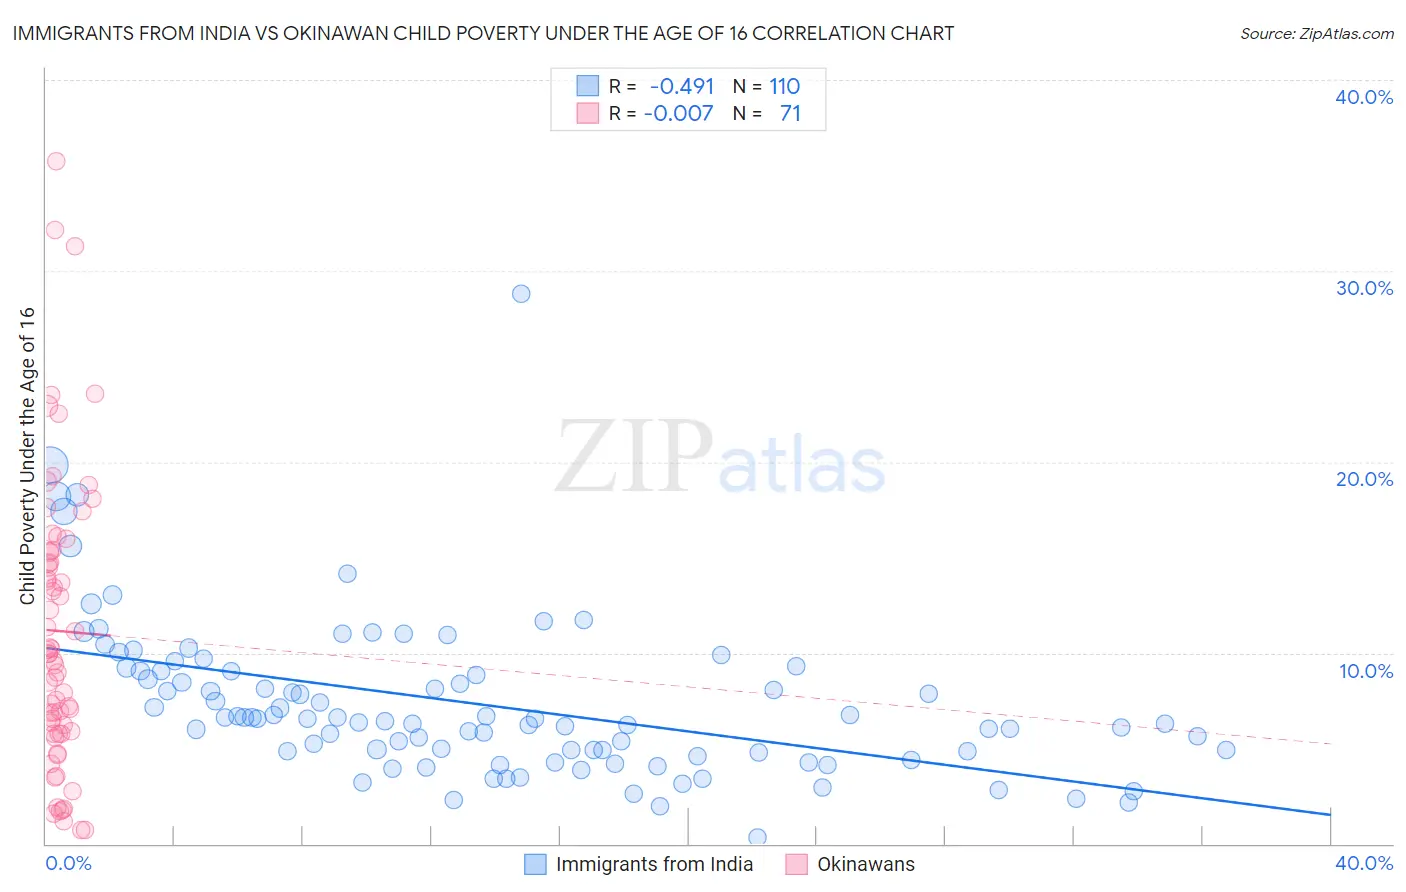
Immigrants from India vs Okinawan Child Poverty Under the Age of 16 Correlation Chart
The statistical analysis conducted on geographies consisting of 429,036,351 people shows a moderate negative correlation between the proportion of Immigrants from India and poverty level among children under the age of 16 in the United States with a correlation coefficient (R) of -0.491 and weighted average of 10.8%. Similarly, the statistical analysis conducted on geographies consisting of 73,512,970 people shows no correlation between the proportion of Okinawans and poverty level among children under the age of 16 in the United States with a correlation coefficient (R) of -0.007 and weighted average of 13.1%, a difference of 21.8%.
Child Poverty Under the Age of 16 Correlation Summary
| Measurement | Immigrants from India | Okinawan |
| Minimum | 0.35% | 0.69% |
| Maximum | 28.8% | 35.7% |
| Range | 28.4% | 35.0% |
| Mean | 7.3% | 11.1% |
| Median | 6.5% | 10.0% |
| Interquartile 25% (IQ1) | 4.8% | 5.8% |
| Interquartile 75% (IQ3) | 9.1% | 15.3% |
| Interquartile Range (IQR) | 4.2% | 9.5% |
| Standard Deviation (Sample) | 4.1% | 7.5% |
| Standard Deviation (Population) | 4.1% | 7.5% |
Demographics Similar to Immigrants from India and Okinawans by Child Poverty Under the Age of 16
In terms of child poverty under the age of 16, the demographic groups most similar to Immigrants from India are Immigrants from Taiwan (11.0%, a difference of 2.5%), Filipino (11.1%, a difference of 3.4%), Thai (11.6%, a difference of 7.4%), Chinese (11.9%, a difference of 10.7%), and Immigrants from Hong Kong (12.1%, a difference of 12.7%). Similarly, the demographic groups most similar to Okinawans are Immigrants from Japan (13.0%, a difference of 0.59%), Cypriot (13.0%, a difference of 0.63%), Bulgarian (13.0%, a difference of 1.1%), Norwegian (13.0%, a difference of 1.3%), and Immigrants from Korea (13.0%, a difference of 1.3%).
| Demographics | Rating | Rank | Child Poverty Under the Age of 16 |
| Immigrants | India | 100.0 /100 | #1 | Exceptional 10.8% |
| Immigrants | Taiwan | 100.0 /100 | #2 | Exceptional 11.0% |
| Filipinos | 100.0 /100 | #3 | Exceptional 11.1% |
| Thais | 100.0 /100 | #4 | Exceptional 11.6% |
| Chinese | 100.0 /100 | #5 | Exceptional 11.9% |
| Immigrants | Hong Kong | 100.0 /100 | #6 | Exceptional 12.1% |
| Iranians | 100.0 /100 | #7 | Exceptional 12.2% |
| Immigrants | Singapore | 100.0 /100 | #8 | Exceptional 12.4% |
| Immigrants | Iran | 100.0 /100 | #9 | Exceptional 12.4% |
| Immigrants | South Central Asia | 99.9 /100 | #10 | Exceptional 12.5% |
| Bhutanese | 99.9 /100 | #11 | Exceptional 12.5% |
| Immigrants | Ireland | 99.9 /100 | #12 | Exceptional 12.7% |
| Burmese | 99.9 /100 | #13 | Exceptional 12.8% |
| Immigrants | Lithuania | 99.9 /100 | #14 | Exceptional 12.9% |
| Immigrants | Korea | 99.9 /100 | #15 | Exceptional 13.0% |
| Norwegians | 99.9 /100 | #16 | Exceptional 13.0% |
| Bulgarians | 99.9 /100 | #17 | Exceptional 13.0% |
| Cypriots | 99.9 /100 | #18 | Exceptional 13.0% |
| Immigrants | Japan | 99.8 /100 | #19 | Exceptional 13.0% |
| Okinawans | 99.8 /100 | #20 | Exceptional 13.1% |