Immigrants from Hungary vs Immigrants from Iran Child Poverty Under the Age of 5
COMPARE
Immigrants from Hungary
Immigrants from Iran
Child Poverty Under the Age of 5
Child Poverty Under the Age of 5 Comparison
Immigrants from Hungary
Immigrants from Iran
16.5%
CHILD POVERTY UNDER THE AGE OF 5
84.5/ 100
METRIC RATING
139th/ 347
METRIC RANK
13.1%
CHILD POVERTY UNDER THE AGE OF 5
100.0/ 100
METRIC RATING
9th/ 347
METRIC RANK
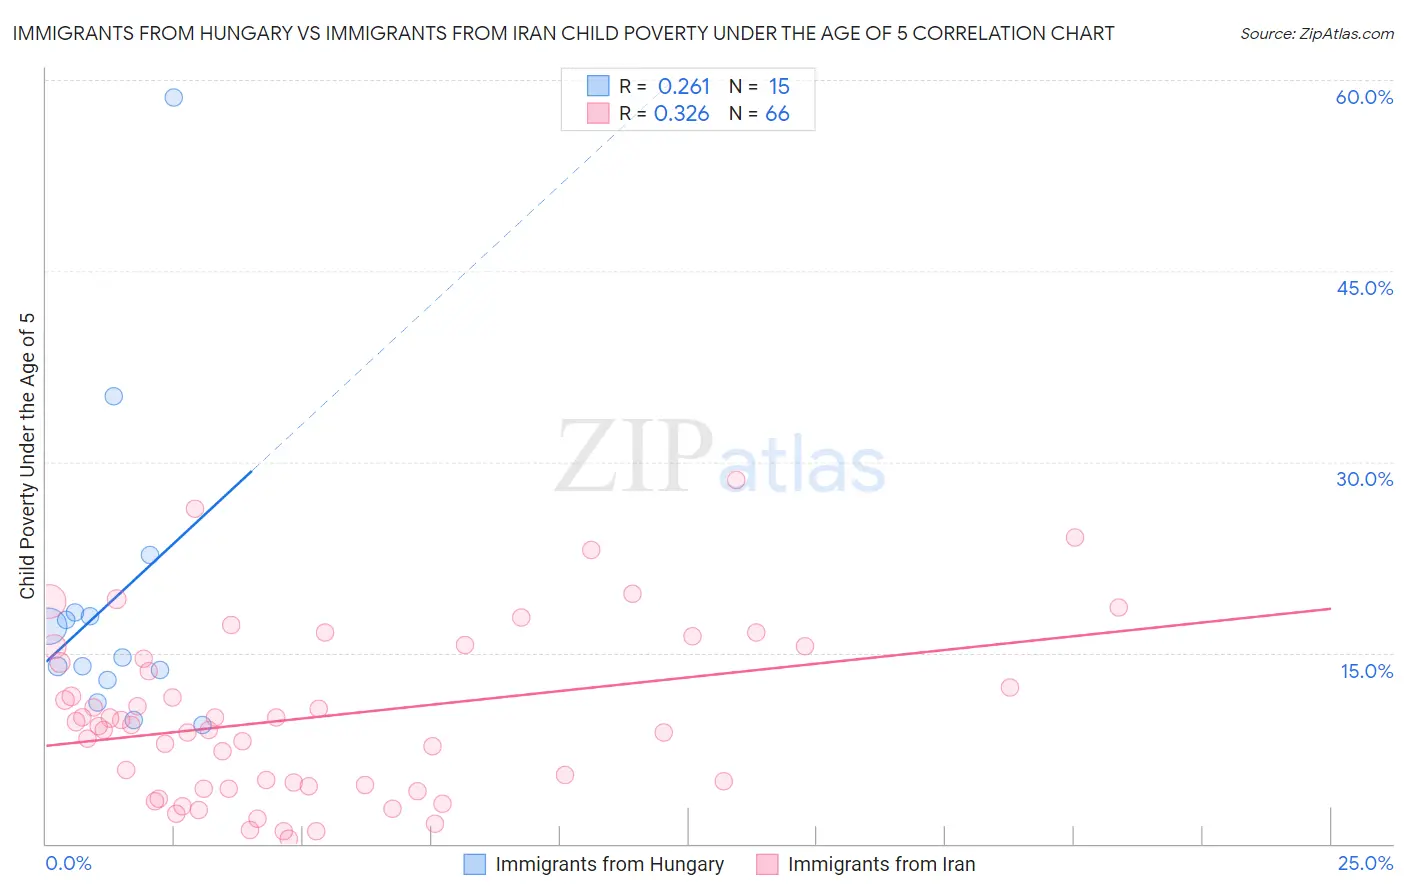
Immigrants from Hungary vs Immigrants from Iran Child Poverty Under the Age of 5 Correlation Chart
The statistical analysis conducted on geographies consisting of 189,885,698 people shows a weak positive correlation between the proportion of Immigrants from Hungary and poverty level among children under the age of 5 in the United States with a correlation coefficient (R) of 0.261 and weighted average of 16.5%. Similarly, the statistical analysis conducted on geographies consisting of 269,372,648 people shows a mild positive correlation between the proportion of Immigrants from Iran and poverty level among children under the age of 5 in the United States with a correlation coefficient (R) of 0.326 and weighted average of 13.1%, a difference of 25.9%.
Child Poverty Under the Age of 5 Correlation Summary
| Measurement | Immigrants from Hungary | Immigrants from Iran |
| Minimum | 9.4% | 0.42% |
| Maximum | 58.6% | 28.6% |
| Range | 49.2% | 28.2% |
| Mean | 19.1% | 10.0% |
| Median | 14.7% | 9.3% |
| Interquartile 25% (IQ1) | 12.8% | 4.6% |
| Interquartile 75% (IQ3) | 18.2% | 14.6% |
| Interquartile Range (IQR) | 5.4% | 10.0% |
| Standard Deviation (Sample) | 12.6% | 6.6% |
| Standard Deviation (Population) | 12.2% | 6.5% |
Similar Demographics by Child Poverty Under the Age of 5
Demographics Similar to Immigrants from Hungary by Child Poverty Under the Age of 5
In terms of child poverty under the age of 5, the demographic groups most similar to Immigrants from Hungary are German (16.5%, a difference of 0.060%), Guamanian/Chamorro (16.5%, a difference of 0.070%), Immigrants from Chile (16.4%, a difference of 0.16%), Immigrants from Western Europe (16.5%, a difference of 0.25%), and Portuguese (16.5%, a difference of 0.30%).
| Demographics | Rating | Rank | Child Poverty Under the Age of 5 |
| Serbians | 88.2 /100 | #132 | Excellent 16.3% |
| Icelanders | 87.9 /100 | #133 | Excellent 16.3% |
| Immigrants | North Macedonia | 87.8 /100 | #134 | Excellent 16.4% |
| Brazilians | 87.8 /100 | #135 | Excellent 16.4% |
| Immigrants | Northern Africa | 87.5 /100 | #136 | Excellent 16.4% |
| Immigrants | Chile | 85.3 /100 | #137 | Excellent 16.4% |
| Germans | 84.8 /100 | #138 | Excellent 16.5% |
| Immigrants | Hungary | 84.5 /100 | #139 | Excellent 16.5% |
| Guamanians/Chamorros | 84.2 /100 | #140 | Excellent 16.5% |
| Immigrants | Western Europe | 83.3 /100 | #141 | Excellent 16.5% |
| Portuguese | 83.0 /100 | #142 | Excellent 16.5% |
| Samoans | 83.0 /100 | #143 | Excellent 16.5% |
| Ethiopians | 82.7 /100 | #144 | Excellent 16.5% |
| Immigrants | Ethiopia | 82.1 /100 | #145 | Excellent 16.6% |
| Israelis | 82.0 /100 | #146 | Excellent 16.6% |
Demographics Similar to Immigrants from Iran by Child Poverty Under the Age of 5
In terms of child poverty under the age of 5, the demographic groups most similar to Immigrants from Iran are Iranian (13.1%, a difference of 0.16%), Chinese (13.1%, a difference of 0.17%), Burmese (13.2%, a difference of 1.1%), Immigrants from Singapore (12.9%, a difference of 1.2%), and Immigrants from Korea (13.2%, a difference of 1.2%).
| Demographics | Rating | Rank | Child Poverty Under the Age of 5 |
| Immigrants | Taiwan | 100.0 /100 | #2 | Exceptional 11.6% |
| Filipinos | 100.0 /100 | #3 | Exceptional 11.6% |
| Thais | 100.0 /100 | #4 | Exceptional 12.3% |
| Immigrants | Hong Kong | 100.0 /100 | #5 | Exceptional 12.4% |
| Immigrants | Singapore | 100.0 /100 | #6 | Exceptional 12.9% |
| Chinese | 100.0 /100 | #7 | Exceptional 13.1% |
| Iranians | 100.0 /100 | #8 | Exceptional 13.1% |
| Immigrants | Iran | 100.0 /100 | #9 | Exceptional 13.1% |
| Burmese | 100.0 /100 | #10 | Exceptional 13.2% |
| Immigrants | Korea | 100.0 /100 | #11 | Exceptional 13.2% |
| Immigrants | South Central Asia | 100.0 /100 | #12 | Exceptional 13.3% |
| Bhutanese | 100.0 /100 | #13 | Exceptional 13.4% |
| Okinawans | 100.0 /100 | #14 | Exceptional 13.4% |
| Indians (Asian) | 100.0 /100 | #15 | Exceptional 13.4% |
| Immigrants | Eastern Asia | 100.0 /100 | #16 | Exceptional 13.5% |