Immigrants from Hong Kong vs Latvian Child Poverty Under the Age of 16
COMPARE
Immigrants from Hong Kong
Latvian
Child Poverty Under the Age of 16
Child Poverty Under the Age of 16 Comparison
Immigrants from Hong Kong
Latvians
12.1%
CHILD POVERTY UNDER THE AGE OF 16
100.0/ 100
METRIC RATING
6th/ 347
METRIC RANK
13.2%
CHILD POVERTY UNDER THE AGE OF 16
99.8/ 100
METRIC RATING
24th/ 347
METRIC RANK
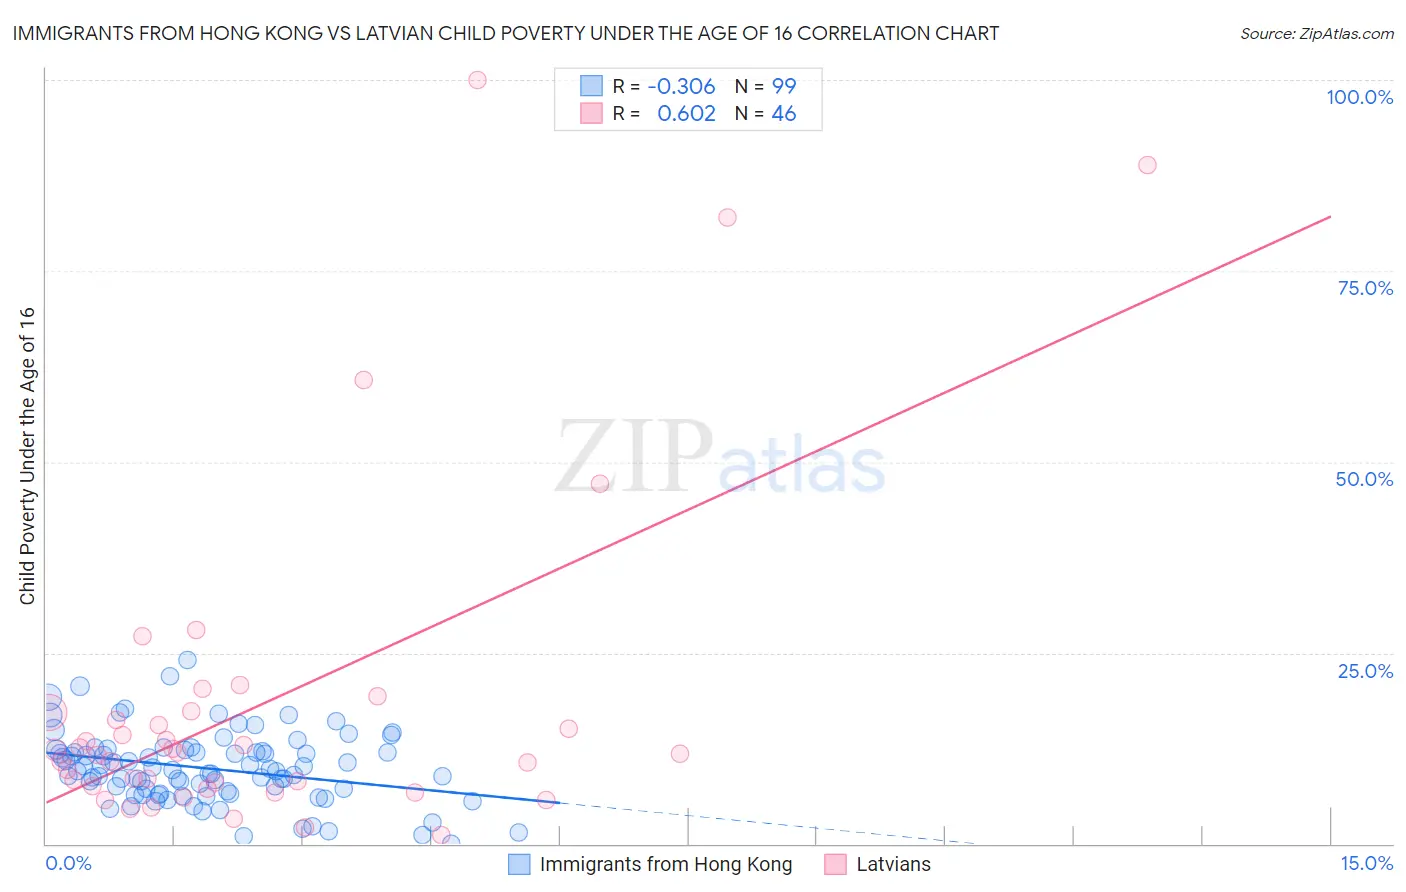
Immigrants from Hong Kong vs Latvian Child Poverty Under the Age of 16 Correlation Chart
The statistical analysis conducted on geographies consisting of 252,108,322 people shows a mild negative correlation between the proportion of Immigrants from Hong Kong and poverty level among children under the age of 16 in the United States with a correlation coefficient (R) of -0.306 and weighted average of 12.1%. Similarly, the statistical analysis conducted on geographies consisting of 218,902,894 people shows a significant positive correlation between the proportion of Latvians and poverty level among children under the age of 16 in the United States with a correlation coefficient (R) of 0.602 and weighted average of 13.2%, a difference of 8.5%.
Child Poverty Under the Age of 16 Correlation Summary
| Measurement | Immigrants from Hong Kong | Latvian |
| Minimum | 0.035% | 1.1% |
| Maximum | 24.0% | 100.0% |
| Range | 24.0% | 98.9% |
| Mean | 9.9% | 18.4% |
| Median | 9.5% | 11.8% |
| Interquartile 25% (IQ1) | 6.6% | 7.5% |
| Interquartile 75% (IQ3) | 12.2% | 17.3% |
| Interquartile Range (IQR) | 5.6% | 9.7% |
| Standard Deviation (Sample) | 4.6% | 22.0% |
| Standard Deviation (Population) | 4.6% | 21.7% |
Demographics Similar to Immigrants from Hong Kong and Latvians by Child Poverty Under the Age of 16
In terms of child poverty under the age of 16, the demographic groups most similar to Immigrants from Hong Kong are Iranian (12.2%, a difference of 0.76%), Chinese (11.9%, a difference of 1.8%), Immigrants from Singapore (12.4%, a difference of 1.9%), Immigrants from Iran (12.4%, a difference of 2.0%), and Immigrants from South Central Asia (12.5%, a difference of 3.2%). Similarly, the demographic groups most similar to Latvians are Eastern European (13.2%, a difference of 0.080%), Indian (Asian) (13.1%, a difference of 0.21%), Maltese (13.1%, a difference of 0.25%), Immigrants from Eastern Asia (13.1%, a difference of 0.33%), and Okinawan (13.1%, a difference of 0.36%).
| Demographics | Rating | Rank | Child Poverty Under the Age of 16 |
| Chinese | 100.0 /100 | #5 | Exceptional 11.9% |
| Immigrants | Hong Kong | 100.0 /100 | #6 | Exceptional 12.1% |
| Iranians | 100.0 /100 | #7 | Exceptional 12.2% |
| Immigrants | Singapore | 100.0 /100 | #8 | Exceptional 12.4% |
| Immigrants | Iran | 100.0 /100 | #9 | Exceptional 12.4% |
| Immigrants | South Central Asia | 99.9 /100 | #10 | Exceptional 12.5% |
| Bhutanese | 99.9 /100 | #11 | Exceptional 12.5% |
| Immigrants | Ireland | 99.9 /100 | #12 | Exceptional 12.7% |
| Burmese | 99.9 /100 | #13 | Exceptional 12.8% |
| Immigrants | Lithuania | 99.9 /100 | #14 | Exceptional 12.9% |
| Immigrants | Korea | 99.9 /100 | #15 | Exceptional 13.0% |
| Norwegians | 99.9 /100 | #16 | Exceptional 13.0% |
| Bulgarians | 99.9 /100 | #17 | Exceptional 13.0% |
| Cypriots | 99.9 /100 | #18 | Exceptional 13.0% |
| Immigrants | Japan | 99.8 /100 | #19 | Exceptional 13.0% |
| Okinawans | 99.8 /100 | #20 | Exceptional 13.1% |
| Immigrants | Eastern Asia | 99.8 /100 | #21 | Exceptional 13.1% |
| Maltese | 99.8 /100 | #22 | Exceptional 13.1% |
| Indians (Asian) | 99.8 /100 | #23 | Exceptional 13.1% |
| Latvians | 99.8 /100 | #24 | Exceptional 13.2% |
| Eastern Europeans | 99.8 /100 | #25 | Exceptional 13.2% |