Immigrants from Honduras vs Osage Child Poverty Under the Age of 5
COMPARE
Immigrants from Honduras
Osage
Child Poverty Under the Age of 5
Child Poverty Under the Age of 5 Comparison
Immigrants from Honduras
Osage
23.5%
CHILD POVERTY UNDER THE AGE OF 5
0.0/ 100
METRIC RATING
321st/ 347
METRIC RANK
19.6%
CHILD POVERTY UNDER THE AGE OF 5
0.5/ 100
METRIC RATING
243rd/ 347
METRIC RANK
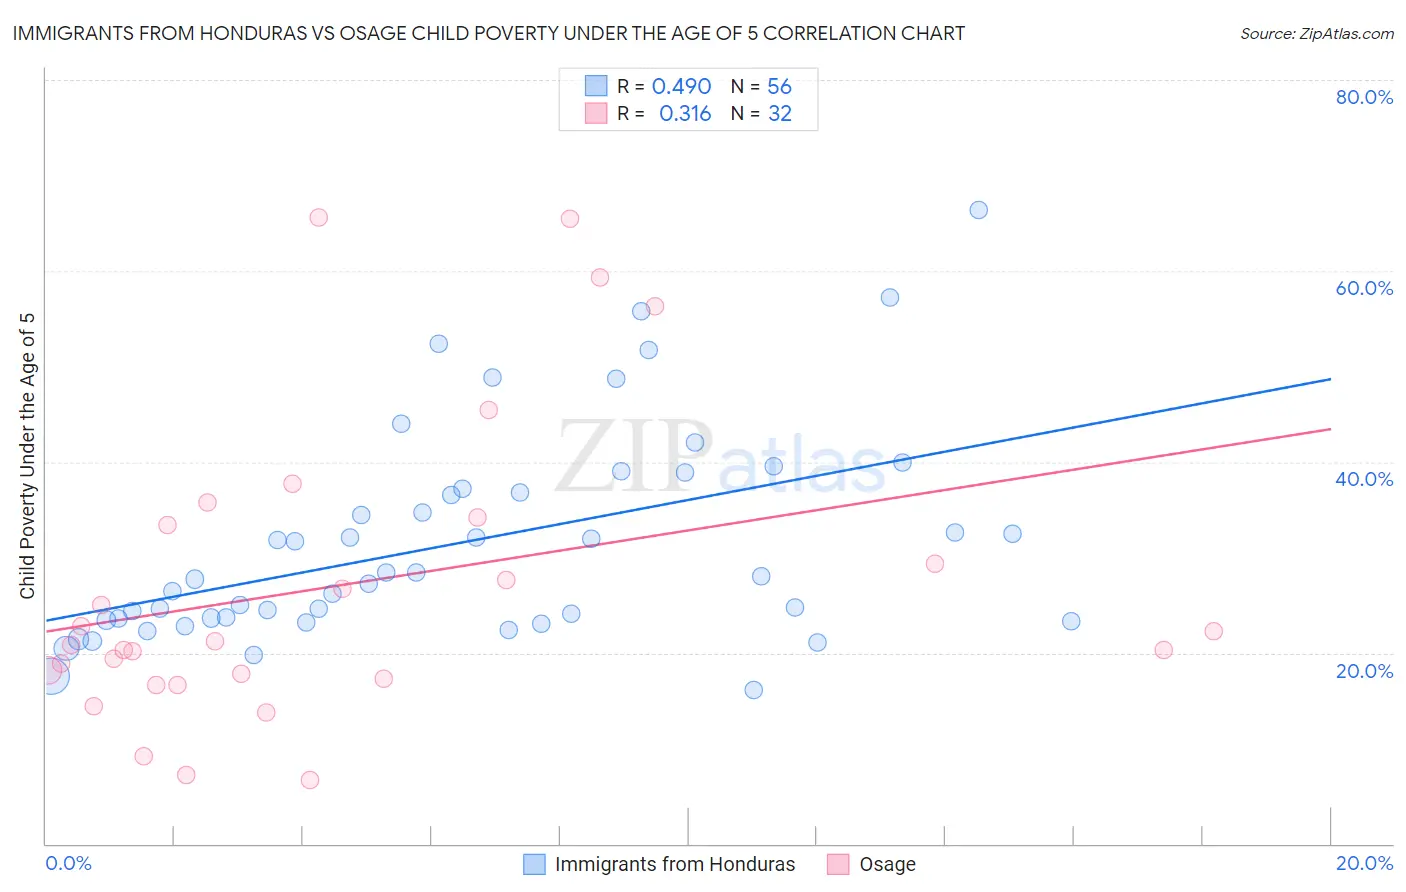
Immigrants from Honduras vs Osage Child Poverty Under the Age of 5 Correlation Chart
The statistical analysis conducted on geographies consisting of 316,401,171 people shows a moderate positive correlation between the proportion of Immigrants from Honduras and poverty level among children under the age of 5 in the United States with a correlation coefficient (R) of 0.490 and weighted average of 23.5%. Similarly, the statistical analysis conducted on geographies consisting of 90,936,218 people shows a mild positive correlation between the proportion of Osage and poverty level among children under the age of 5 in the United States with a correlation coefficient (R) of 0.316 and weighted average of 19.6%, a difference of 19.6%.
Child Poverty Under the Age of 5 Correlation Summary
| Measurement | Immigrants from Honduras | Osage |
| Minimum | 16.1% | 6.7% |
| Maximum | 66.4% | 65.6% |
| Range | 50.2% | 59.0% |
| Mean | 31.5% | 27.0% |
| Median | 27.9% | 21.0% |
| Interquartile 25% (IQ1) | 23.5% | 17.5% |
| Interquartile 75% (IQ3) | 37.0% | 33.8% |
| Interquartile Range (IQR) | 13.5% | 16.2% |
| Standard Deviation (Sample) | 11.0% | 15.9% |
| Standard Deviation (Population) | 10.9% | 15.6% |
Similar Demographics by Child Poverty Under the Age of 5
Demographics Similar to Immigrants from Honduras by Child Poverty Under the Age of 5
In terms of child poverty under the age of 5, the demographic groups most similar to Immigrants from Honduras are Choctaw (23.5%, a difference of 0.030%), Ute (23.5%, a difference of 0.23%), Chippewa (23.4%, a difference of 0.41%), Pueblo (23.7%, a difference of 0.81%), and Dutch West Indian (23.3%, a difference of 0.89%).
| Demographics | Rating | Rank | Child Poverty Under the Age of 5 |
| U.S. Virgin Islanders | 0.0 /100 | #314 | Tragic 23.0% |
| Arapaho | 0.0 /100 | #315 | Tragic 23.1% |
| Yakama | 0.0 /100 | #316 | Tragic 23.1% |
| Menominee | 0.0 /100 | #317 | Tragic 23.3% |
| Dutch West Indians | 0.0 /100 | #318 | Tragic 23.3% |
| Chippewa | 0.0 /100 | #319 | Tragic 23.4% |
| Choctaw | 0.0 /100 | #320 | Tragic 23.5% |
| Immigrants | Honduras | 0.0 /100 | #321 | Tragic 23.5% |
| Ute | 0.0 /100 | #322 | Tragic 23.5% |
| Pueblo | 0.0 /100 | #323 | Tragic 23.7% |
| Paiute | 0.0 /100 | #324 | Tragic 23.8% |
| Immigrants | Congo | 0.0 /100 | #325 | Tragic 23.9% |
| Central American Indians | 0.0 /100 | #326 | Tragic 23.9% |
| Dominicans | 0.0 /100 | #327 | Tragic 24.0% |
| Immigrants | Dominican Republic | 0.0 /100 | #328 | Tragic 24.1% |
Demographics Similar to Osage by Child Poverty Under the Age of 5
In terms of child poverty under the age of 5, the demographic groups most similar to Osage are Immigrants from Ghana (19.6%, a difference of 0.020%), Immigrants from Guyana (19.6%, a difference of 0.10%), Immigrants from Western Africa (19.7%, a difference of 0.21%), Alaska Native (19.6%, a difference of 0.22%), and Immigrants from Ecuador (19.6%, a difference of 0.28%).
| Demographics | Rating | Rank | Child Poverty Under the Age of 5 |
| Immigrants | Trinidad and Tobago | 0.8 /100 | #236 | Tragic 19.4% |
| Immigrants | Cabo Verde | 0.6 /100 | #237 | Tragic 19.5% |
| Salvadorans | 0.6 /100 | #238 | Tragic 19.5% |
| Vietnamese | 0.6 /100 | #239 | Tragic 19.5% |
| Immigrants | Ecuador | 0.5 /100 | #240 | Tragic 19.6% |
| Alaska Natives | 0.5 /100 | #241 | Tragic 19.6% |
| Immigrants | Guyana | 0.5 /100 | #242 | Tragic 19.6% |
| Osage | 0.5 /100 | #243 | Tragic 19.6% |
| Immigrants | Ghana | 0.5 /100 | #244 | Tragic 19.6% |
| Immigrants | Western Africa | 0.4 /100 | #245 | Tragic 19.7% |
| Cree | 0.4 /100 | #246 | Tragic 19.7% |
| Guyanese | 0.4 /100 | #247 | Tragic 19.7% |
| Marshallese | 0.4 /100 | #248 | Tragic 19.7% |
| Immigrants | Middle Africa | 0.4 /100 | #249 | Tragic 19.7% |
| Immigrants | Nonimmigrants | 0.4 /100 | #250 | Tragic 19.7% |