Immigrants from Honduras vs Immigrants from Romania Female Poverty Among 25-34 Year Olds

COMPARE

Immigrants from Honduras
Race
Ancestry
AfghanAfricanAlaska NativeAlaskan AthabascanAlbanianAleutAlsatianAmericanApacheArabArapahoArgentineanArmenianAssyrian/Chaldean/SyriacAustralianAustrianBahamianBangladeshiBarbadianBasqueBelgianBelizeanBermudanBhutaneseBlackfeetBolivianBrazilianBritishBritish West IndianBulgarianBurmeseCajunCambodianCanadianCape VerdeanCarpatho RusynCelticCentral AmericanCentral American IndianCherokeeCheyenneChickasawChileanChineseChippewaChoctawColombianColvilleComancheCosta RicanCreeCreekCroatianCrowCubanCypriotCzechCzechoslovakianDanishDelawareDominicanDutchDutch West IndianEastern EuropeanEcuadorianEgyptianEnglishEstonianEthiopianEuropeanFijianFilipinoFinnishFrenchFrench American IndianFrench CanadianGermanGerman RussianGhanaianGreekGuamanian/ChamorroGuatemalanGuyaneseHaitianHmongHonduranHopiHoumaHungarianIcelanderIndian (Asian)IndonesianInupiatIranianIraqiIrishIroquoisIsraeliItalianJamaicanJapaneseJordanianKenyanKiowaKoreanLaotianLatvianLebaneseLiberianLithuanianLumbeeLuxembourgerMacedonianMalaysianMalteseMarshalleseMenomineeMexicanMexican American IndianMongolianMoroccanNative HawaiianNavajoNepaleseNew ZealanderNicaraguanNigerianNorthern EuropeanNorwegianOkinawanOsageOttawaPaiutePakistaniPalestinianPanamanianParaguayanPennsylvania GermanPeruvianPimaPolishPortuguesePotawatomiPuebloPuerto RicanPuget Sound SalishRomanianRussianSalvadoranSamoanScandinavianScotch-IrishScottishSeminoleSenegaleseSerbianShoshoneSierra LeoneanSiouxSlavicSlovakSloveneSomaliSouth AfricanSouth AmericanSouth American IndianSoviet UnionSpaniardSpanishSpanish AmericanSpanish American IndianSri LankanSubsaharan AfricanSudaneseSwedishSwissSyrianTaiwaneseThaiTlingit-HaidaTohono O'OdhamTonganTrinidadian and TobagonianTsimshianTurkishU.S. Virgin IslanderUgandanUkrainianUruguayanUteVenezuelanVietnameseWelshWest IndianYakamaYaquiYugoslavianYumanYup'ikZimbabwean
Immigration
NonimmigrantsImmigrantsAfghanistanAfricaAlbaniaArgentinaArmeniaAsiaAustraliaAustriaBahamasBangladeshBarbadosBelarusBelgiumBelizeBoliviaBosnia and HerzegovinaBrazilBulgariaBurma/MyanmarCabo VerdeCambodiaCameroonCanadaCaribbeanCentral AmericaChileChinaColombiaCongoCosta RicaCroatiaCubaCzechoslovakiaDenmarkDominicaDominican RepublicEastern AfricaEastern AsiaEastern EuropeEcuadorEgyptEl SalvadorEnglandEritreaEthiopiaEuropeFijiFranceGermanyGhanaGreeceGrenadaGuatemalaGuyanaHaitiHondurasHong KongHungaryIndiaIndonesiaIranIraqIrelandIsraelItalyJamaicaJapanJordanKazakhstanKenyaKoreaKuwaitLaosLatin AmericaLatviaLebanonLiberiaLithuaniaMalaysiaMexicoMicronesiaMiddle AfricaMoldovaMoroccoNepalNetherlandsNicaraguaNigeriaNorth AmericaNorth MacedoniaNorthern AfricaNorthern EuropeNorwayOceaniaPakistanPanamaPeruPhilippinesPolandPortugalRussiaSaudi ArabiaScotlandSenegalSerbiaSierra LeoneSingaporeSomaliaSouth AfricaSouth AmericaSouth Central AsiaSouth Eastern AsiaSouthern EuropeSpainSri LankaSt. Vincent and the GrenadinesSudanSwedenSwitzerlandSyriaTaiwanThailandTrinidad and TobagoTurkeyUgandaUkraineUruguayUzbekistanVenezuelaVietnamWest IndiesWestern AfricaWestern AsiaWestern EuropeYemenZaireZimbabweAzores
Immigrants from Romania
Race
Ancestry
AfghanAfricanAlaska NativeAlaskan AthabascanAlbanianAleutAlsatianAmericanApacheArabArapahoArgentineanArmenianAssyrian/Chaldean/SyriacAustralianAustrianBahamianBangladeshiBarbadianBasqueBelgianBelizeanBermudanBhutaneseBlackfeetBolivianBrazilianBritishBritish West IndianBulgarianBurmeseCajunCambodianCanadianCape VerdeanCarpatho RusynCelticCentral AmericanCentral American IndianCherokeeCheyenneChickasawChileanChineseChippewaChoctawColombianColvilleComancheCosta RicanCreeCreekCroatianCrowCubanCypriotCzechCzechoslovakianDanishDelawareDominicanDutchDutch West IndianEastern EuropeanEcuadorianEgyptianEnglishEstonianEthiopianEuropeanFijianFilipinoFinnishFrenchFrench American IndianFrench CanadianGermanGerman RussianGhanaianGreekGuamanian/ChamorroGuatemalanGuyaneseHaitianHmongHonduranHopiHoumaHungarianIcelanderIndian (Asian)IndonesianInupiatIranianIraqiIrishIroquoisIsraeliItalianJamaicanJapaneseJordanianKenyanKiowaKoreanLaotianLatvianLebaneseLiberianLithuanianLumbeeLuxembourgerMacedonianMalaysianMalteseMarshalleseMenomineeMexicanMexican American IndianMongolianMoroccanNative HawaiianNavajoNepaleseNew ZealanderNicaraguanNigerianNorthern EuropeanNorwegianOkinawanOsageOttawaPaiutePakistaniPalestinianPanamanianParaguayanPennsylvania GermanPeruvianPimaPolishPortuguesePotawatomiPuebloPuerto RicanPuget Sound SalishRomanianRussianSalvadoranSamoanScandinavianScotch-IrishScottishSeminoleSenegaleseSerbianShoshoneSierra LeoneanSiouxSlavicSlovakSloveneSomaliSouth AfricanSouth AmericanSouth American IndianSoviet UnionSpaniardSpanishSpanish AmericanSpanish American IndianSri LankanSubsaharan AfricanSudaneseSwedishSwissSyrianTaiwaneseThaiTlingit-HaidaTohono O'OdhamTonganTrinidadian and TobagonianTsimshianTurkishU.S. Virgin IslanderUgandanUkrainianUruguayanUteVenezuelanVietnameseWelshWest IndianYakamaYaquiYugoslavianYumanYup'ikZimbabwean
Immigration
NonimmigrantsImmigrantsAfghanistanAfricaAlbaniaArgentinaArmeniaAsiaAustraliaAustriaBahamasBangladeshBarbadosBelarusBelgiumBelizeBoliviaBosnia and HerzegovinaBrazilBulgariaBurma/MyanmarCabo VerdeCambodiaCameroonCanadaCaribbeanCentral AmericaChileChinaColombiaCongoCosta RicaCroatiaCubaCzechoslovakiaDenmarkDominicaDominican RepublicEastern AfricaEastern AsiaEastern EuropeEcuadorEgyptEl SalvadorEnglandEritreaEthiopiaEuropeFijiFranceGermanyGhanaGreeceGrenadaGuatemalaGuyanaHaitiHong KongHungaryIndiaIndonesiaIranIraqIrelandIsraelItalyJamaicaJapanJordanKazakhstanKenyaKoreaKuwaitLaosLatin AmericaLatviaLebanonLiberiaLithuaniaMalaysiaMexicoMicronesiaMiddle AfricaMoldovaMoroccoNepalNetherlandsNicaraguaNigeriaNorth AmericaNorth MacedoniaNorthern AfricaNorthern EuropeNorwayOceaniaPakistanPanamaPeruPhilippinesPolandPortugalRomaniaRussiaSaudi ArabiaScotlandSenegalSerbiaSierra LeoneSingaporeSomaliaSouth AfricaSouth AmericaSouth Central AsiaSouth Eastern AsiaSouthern EuropeSpainSri LankaSt. Vincent and the GrenadinesSudanSwedenSwitzerlandSyriaTaiwanThailandTrinidad and TobagoTurkeyUgandaUkraineUruguayUzbekistanVenezuelaVietnamWest IndiesWestern AfricaWestern AsiaWestern EuropeYemenZaireZimbabweAzores
Female Poverty Among 25-34 Year Olds
Income
Poverty
Unemployment
Labor Participation
Family Structure
Vehicle Availability
Education Level
Disability

Female Poverty Among 25-34 Year Olds Comparison

Immigrants from Honduras

Immigrants from Romania

Tragic
Exceptional
17.3%
FEMALE POVERTY AMONG 25-34 YEAR OLDS
0.0/ 100
METRIC RATING
311th/ 347
METRIC RANK
12.1%
FEMALE POVERTY AMONG 25-34 YEAR OLDS
99.4/ 100
METRIC RATING
58th/ 347
METRIC RANK

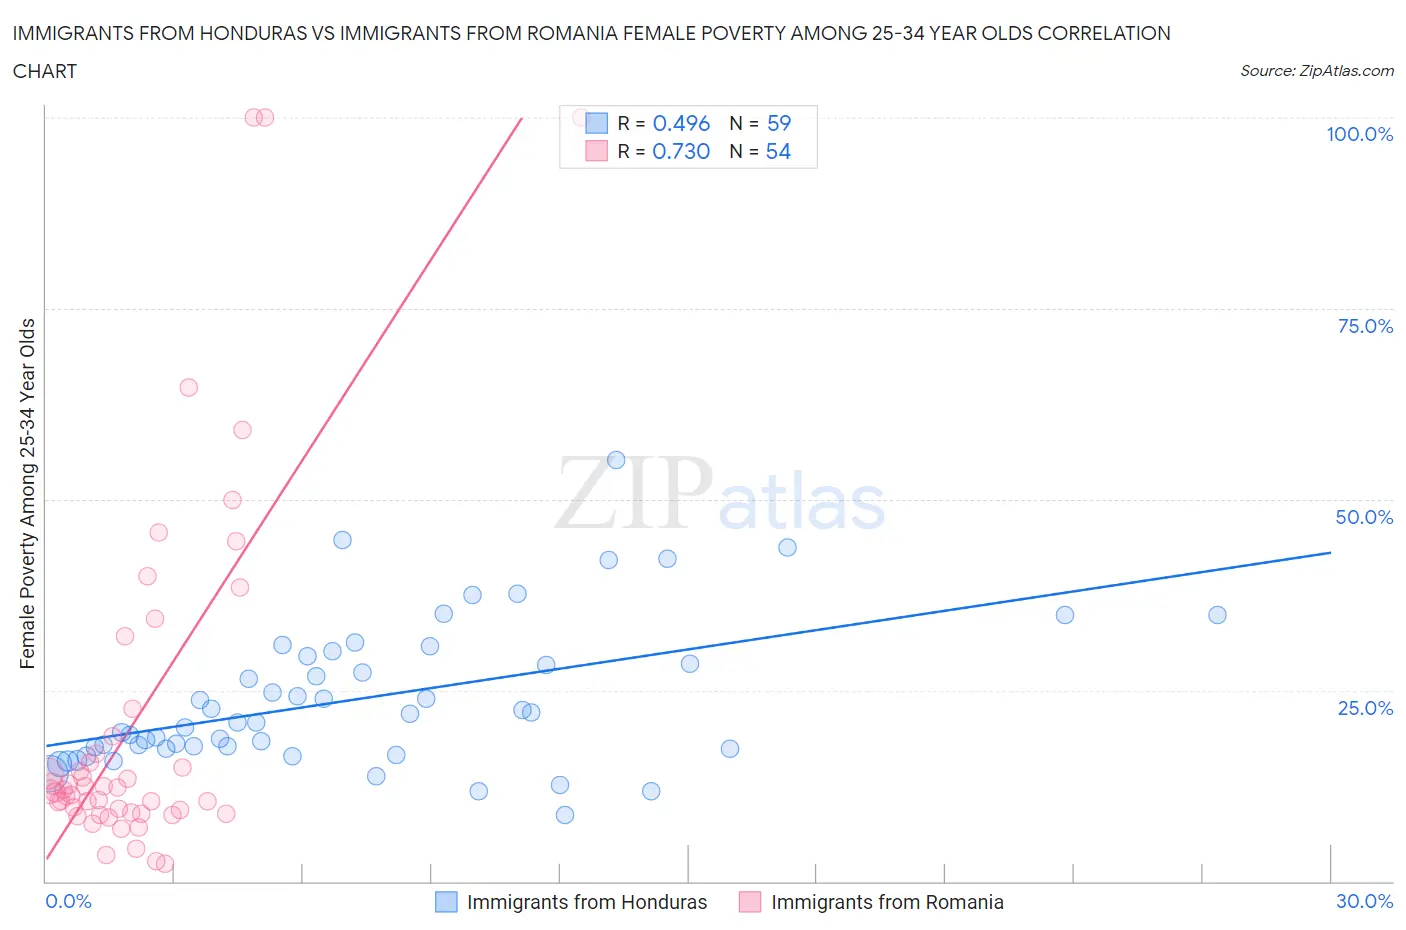
Immigrants from Honduras vs Immigrants from Romania Female Poverty Among 25-34 Year Olds Correlation Chart

The statistical analysis conducted on geographies consisting of 320,147,066 people shows a moderate positive correlation between the proportion of Immigrants from Honduras and poverty level among females between the ages 25 and 34 in the United States with a correlation coefficient (R) of 0.496 and weighted average of 17.3%. Similarly, the statistical analysis conducted on geographies consisting of 253,928,147 people shows a strong positive correlation between the proportion of Immigrants from Romania and poverty level among females between the ages 25 and 34 in the United States with a correlation coefficient (R) of 0.730 and weighted average of 12.1%, a difference of 42.7%.
Immigrants from Honduras vs Immigrants from Romania Female Poverty Among 25-34 Year Olds

Female Poverty Among 25-34 Year Olds Correlation Summary

MeasurementImmigrants from HondurasImmigrants from Romania
Minimum8.6%2.3%
Maximum55.1%100.0%
Range46.5%97.7%
Mean23.9%21.5%
Median20.8%11.8%
Interquartile 25% (IQ1)17.3%9.0%
Interquartile 75% (IQ3)29.5%19.0%
Interquartile Range (IQR)12.2%10.0%
Standard Deviation (Sample)9.6%23.8%
Standard Deviation (Population)9.5%23.6%

Similar Demographics by Female Poverty Among 25-34 Year Olds

Demographics Similar to Immigrants from Honduras by Female Poverty Among 25-34 Year Olds

In terms of female poverty among 25-34 year olds, the demographic groups most similar to Immigrants from Honduras are Cherokee (17.2%, a difference of 0.48%), Ottawa (17.1%, a difference of 0.95%), Iroquois (17.5%, a difference of 1.1%), Colville (17.5%, a difference of 1.2%), and African (17.0%, a difference of 1.3%).
DemographicsRating | RankFemale Poverty Among 25-34 Year Olds
Hondurans
0.0
/100
|
#304
Tragic
16.9%
Immigrants | Cabo Verde
0.0
/100
|
#305
Tragic
16.9%
Chickasaw
0.0
/100
|
#306
Tragic
17.0%
Yaqui
0.0
/100
|
#307
Tragic
17.0%
Africans
0.0
/100
|
#308
Tragic
17.0%
Ottawa
0.0
/100
|
#309
Tragic
17.1%
Cherokee
0.0
/100
|
#310
Tragic
17.2%
Immigrants | Honduras
0.0
/100
|
#311
Tragic
17.3%
Iroquois
0.0
/100
|
#312
Tragic
17.5%
Colville
0.0
/100
|
#313
Tragic
17.5%
Immigrants | Dominican Republic
0.0
/100
|
#314
Tragic
17.6%
Yakama
0.0
/100
|
#315
Tragic
17.6%
Dominicans
0.0
/100
|
#316
Tragic
17.6%
Arapaho
0.0
/100
|
#317
Tragic
17.8%
Ute
0.0
/100
|
#318
Tragic
17.9%

Demographics Similar to Immigrants from Romania by Female Poverty Among 25-34 Year Olds

In terms of female poverty among 25-34 year olds, the demographic groups most similar to Immigrants from Romania are Russian (12.1%, a difference of 0.0%), Immigrants from Northern Europe (12.1%, a difference of 0.090%), Immigrants from Czechoslovakia (12.1%, a difference of 0.11%), Jordanian (12.1%, a difference of 0.21%), and Luxembourger (12.1%, a difference of 0.22%).
DemographicsRating | RankFemale Poverty Among 25-34 Year Olds
Paraguayans
99.6
/100
|
#51
Exceptional
12.0%
Immigrants | Eastern Europe
99.6
/100
|
#52
Exceptional
12.0%
Immigrants | Israel
99.6
/100
|
#53
Exceptional
12.0%
Eastern Europeans
99.6
/100
|
#54
Exceptional
12.0%
Immigrants | Philippines
99.5
/100
|
#55
Exceptional
12.0%
Luxembourgers
99.5
/100
|
#56
Exceptional
12.1%
Jordanians
99.4
/100
|
#57
Exceptional
12.1%
Immigrants | Romania
99.4
/100
|
#58
Exceptional
12.1%
Russians
99.4
/100
|
#59
Exceptional
12.1%
Immigrants | Northern Europe
99.4
/100
|
#60
Exceptional
12.1%
Immigrants | Czechoslovakia
99.4
/100
|
#61
Exceptional
12.1%
Immigrants | Moldova
99.3
/100
|
#62
Exceptional
12.1%
Soviet Union
99.3
/100
|
#63
Exceptional
12.1%
Immigrants | Russia
99.2
/100
|
#64
Exceptional
12.2%
Armenians
99.2
/100
|
#65
Exceptional
12.2%