Immigrants from Haiti vs Immigrants from Denmark Female Poverty Among 18-24 Year Olds
COMPARE
Immigrants from Haiti
Immigrants from Denmark
Female Poverty Among 18-24 Year Olds
Female Poverty Among 18-24 Year Olds Comparison
Immigrants from Haiti
Immigrants from Denmark
18.7%
FEMALE POVERTY AMONG 18-24 YEAR OLDS
99.7/ 100
METRIC RATING
71st/ 347
METRIC RANK
20.8%
FEMALE POVERTY AMONG 18-24 YEAR OLDS
5.8/ 100
METRIC RATING
233rd/ 347
METRIC RANK
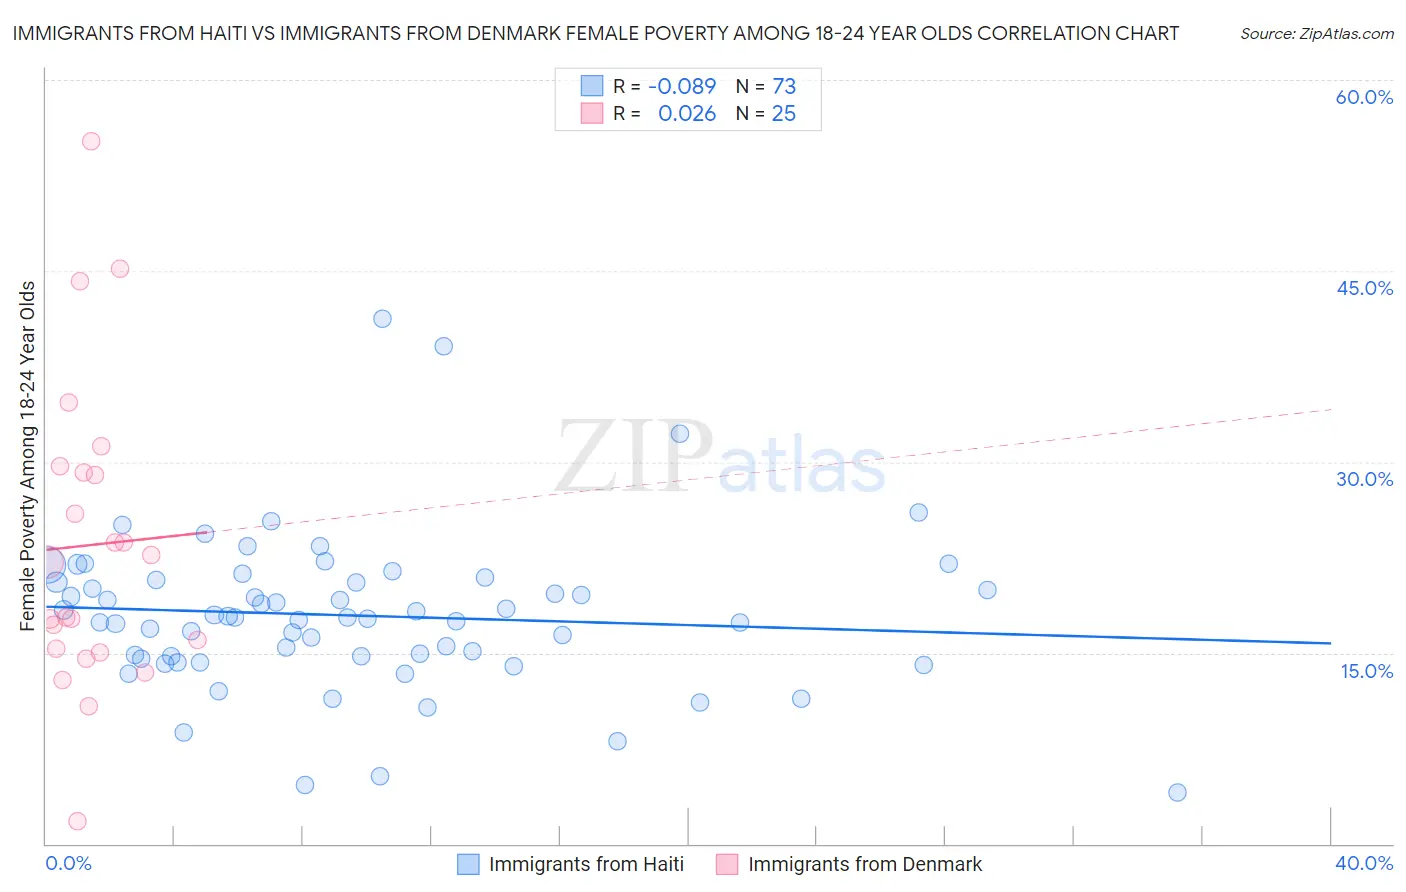
Immigrants from Haiti vs Immigrants from Denmark Female Poverty Among 18-24 Year Olds Correlation Chart
The statistical analysis conducted on geographies consisting of 221,211,252 people shows a slight negative correlation between the proportion of Immigrants from Haiti and poverty level among females between the ages 18 and 24 in the United States with a correlation coefficient (R) of -0.089 and weighted average of 18.7%. Similarly, the statistical analysis conducted on geographies consisting of 134,710,219 people shows no correlation between the proportion of Immigrants from Denmark and poverty level among females between the ages 18 and 24 in the United States with a correlation coefficient (R) of 0.026 and weighted average of 20.8%, a difference of 11.3%.
Female Poverty Among 18-24 Year Olds Correlation Summary
| Measurement | Immigrants from Haiti | Immigrants from Denmark |
| Minimum | 4.0% | 1.8% |
| Maximum | 41.2% | 55.2% |
| Range | 37.2% | 53.4% |
| Mean | 17.9% | 23.5% |
| Median | 17.7% | 22.1% |
| Interquartile 25% (IQ1) | 14.6% | 15.2% |
| Interquartile 75% (IQ3) | 20.7% | 29.4% |
| Interquartile Range (IQR) | 6.0% | 14.2% |
| Standard Deviation (Sample) | 6.2% | 12.0% |
| Standard Deviation (Population) | 6.1% | 11.8% |
Similar Demographics by Female Poverty Among 18-24 Year Olds
Demographics Similar to Immigrants from Haiti by Female Poverty Among 18-24 Year Olds
In terms of female poverty among 18-24 year olds, the demographic groups most similar to Immigrants from Haiti are Armenian (18.7%, a difference of 0.020%), Immigrants from Costa Rica (18.7%, a difference of 0.060%), Lithuanian (18.7%, a difference of 0.060%), Immigrants from Bulgaria (18.6%, a difference of 0.17%), and Hawaiian (18.7%, a difference of 0.24%).
| Demographics | Rating | Rank | Female Poverty Among 18-24 Year Olds |
| Immigrants | Asia | 99.8 /100 | #64 | Exceptional 18.6% |
| Immigrants | Scotland | 99.8 /100 | #65 | Exceptional 18.6% |
| Jordanians | 99.8 /100 | #66 | Exceptional 18.6% |
| Immigrants | Korea | 99.8 /100 | #67 | Exceptional 18.6% |
| Brazilians | 99.8 /100 | #68 | Exceptional 18.6% |
| Immigrants | Bulgaria | 99.7 /100 | #69 | Exceptional 18.6% |
| Immigrants | Costa Rica | 99.7 /100 | #70 | Exceptional 18.7% |
| Immigrants | Haiti | 99.7 /100 | #71 | Exceptional 18.7% |
| Armenians | 99.7 /100 | #72 | Exceptional 18.7% |
| Lithuanians | 99.7 /100 | #73 | Exceptional 18.7% |
| Hawaiians | 99.6 /100 | #74 | Exceptional 18.7% |
| Poles | 99.6 /100 | #75 | Exceptional 18.8% |
| Immigrants | Cambodia | 99.5 /100 | #76 | Exceptional 18.8% |
| Costa Ricans | 99.5 /100 | #77 | Exceptional 18.8% |
| Immigrants | Europe | 99.5 /100 | #78 | Exceptional 18.8% |
Demographics Similar to Immigrants from Denmark by Female Poverty Among 18-24 Year Olds
In terms of female poverty among 18-24 year olds, the demographic groups most similar to Immigrants from Denmark are Finnish (20.8%, a difference of 0.030%), Immigrants from St. Vincent and the Grenadines (20.8%, a difference of 0.040%), Australian (20.8%, a difference of 0.060%), White/Caucasian (20.8%, a difference of 0.060%), and Welsh (20.8%, a difference of 0.10%).
| Demographics | Rating | Rank | Female Poverty Among 18-24 Year Olds |
| Estonians | 7.2 /100 | #226 | Tragic 20.7% |
| Immigrants | Sweden | 6.8 /100 | #227 | Tragic 20.7% |
| Ghanaians | 6.5 /100 | #228 | Tragic 20.8% |
| Australians | 6.1 /100 | #229 | Tragic 20.8% |
| Whites/Caucasians | 6.1 /100 | #230 | Tragic 20.8% |
| Immigrants | St. Vincent and the Grenadines | 6.0 /100 | #231 | Tragic 20.8% |
| Finns | 6.0 /100 | #232 | Tragic 20.8% |
| Immigrants | Denmark | 5.8 /100 | #233 | Tragic 20.8% |
| Welsh | 5.4 /100 | #234 | Tragic 20.8% |
| Immigrants | Uganda | 5.1 /100 | #235 | Tragic 20.8% |
| Okinawans | 4.9 /100 | #236 | Tragic 20.8% |
| Scottish | 4.5 /100 | #237 | Tragic 20.9% |
| Immigrants | Singapore | 4.4 /100 | #238 | Tragic 20.9% |
| Immigrants | Guatemala | 4.3 /100 | #239 | Tragic 20.9% |
| Luxembourgers | 4.2 /100 | #240 | Tragic 20.9% |