Immigrants from Guyana vs Spanish American Female Poverty Among 18-24 Year Olds
COMPARE
Immigrants from Guyana
Spanish American
Female Poverty Among 18-24 Year Olds
Female Poverty Among 18-24 Year Olds Comparison
Immigrants from Guyana
Spanish Americans
19.3%
FEMALE POVERTY AMONG 18-24 YEAR OLDS
95.6/ 100
METRIC RATING
118th/ 347
METRIC RANK
21.9%
FEMALE POVERTY AMONG 18-24 YEAR OLDS
0.1/ 100
METRIC RATING
279th/ 347
METRIC RANK
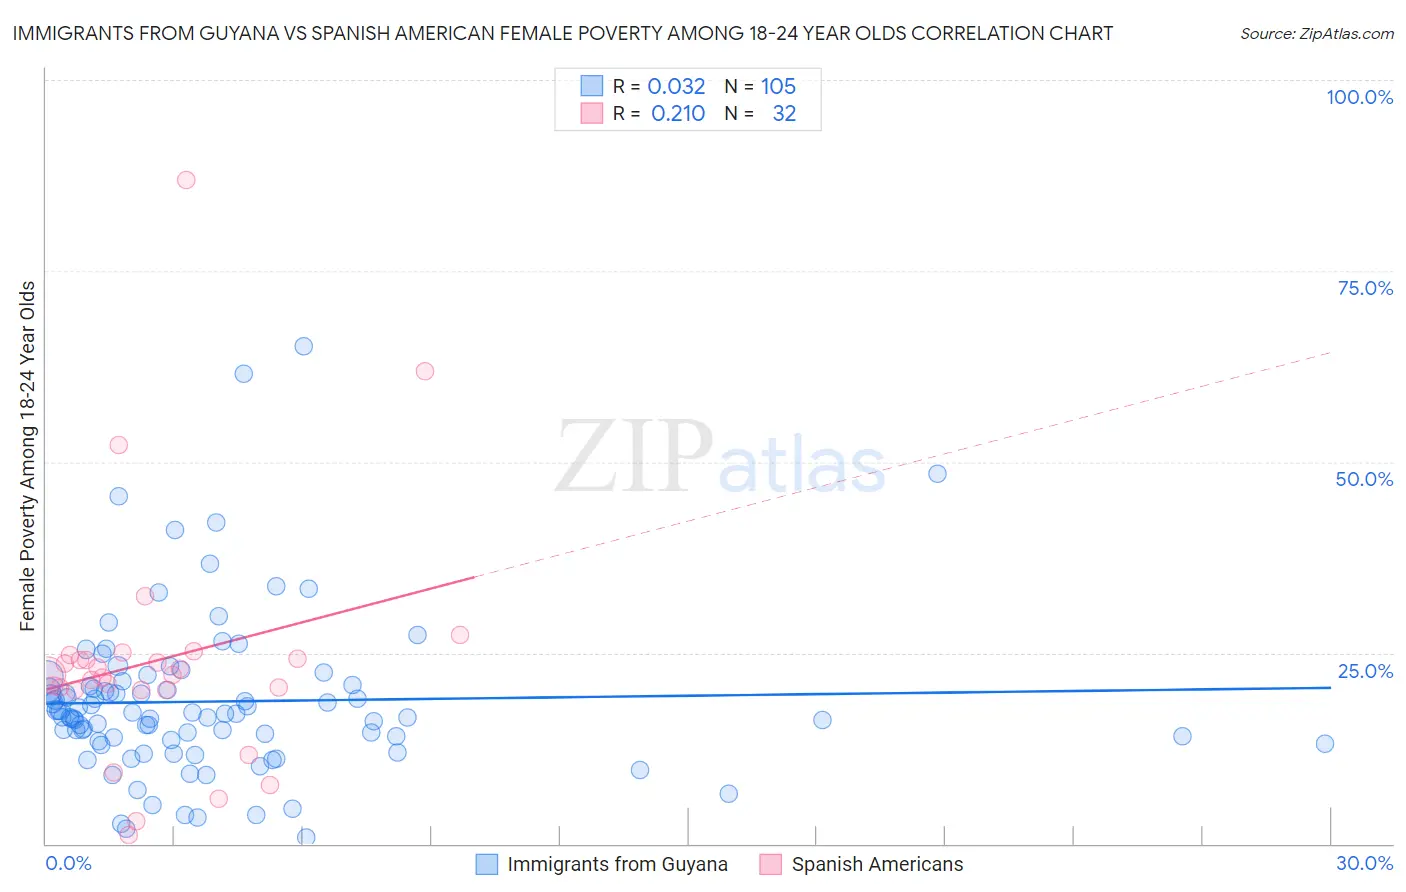
Immigrants from Guyana vs Spanish American Female Poverty Among 18-24 Year Olds Correlation Chart
The statistical analysis conducted on geographies consisting of 181,126,975 people shows no correlation between the proportion of Immigrants from Guyana and poverty level among females between the ages 18 and 24 in the United States with a correlation coefficient (R) of 0.032 and weighted average of 19.3%. Similarly, the statistical analysis conducted on geographies consisting of 102,596,848 people shows a weak positive correlation between the proportion of Spanish Americans and poverty level among females between the ages 18 and 24 in the United States with a correlation coefficient (R) of 0.210 and weighted average of 21.9%, a difference of 13.3%.
Female Poverty Among 18-24 Year Olds Correlation Summary
| Measurement | Immigrants from Guyana | Spanish American |
| Minimum | 0.84% | 1.1% |
| Maximum | 65.1% | 87.0% |
| Range | 64.3% | 85.8% |
| Mean | 18.6% | 24.1% |
| Median | 16.9% | 22.1% |
| Interquartile 25% (IQ1) | 13.5% | 20.2% |
| Interquartile 75% (IQ3) | 20.7% | 24.5% |
| Interquartile Range (IQR) | 7.2% | 4.3% |
| Standard Deviation (Sample) | 10.6% | 16.4% |
| Standard Deviation (Population) | 10.6% | 16.1% |
Similar Demographics by Female Poverty Among 18-24 Year Olds
Demographics Similar to Immigrants from Guyana by Female Poverty Among 18-24 Year Olds
In terms of female poverty among 18-24 year olds, the demographic groups most similar to Immigrants from Guyana are Cypriot (19.3%, a difference of 0.020%), Immigrants from Iran (19.3%, a difference of 0.060%), Immigrants from Northern Europe (19.4%, a difference of 0.060%), Immigrants (19.3%, a difference of 0.090%), and Guyanese (19.4%, a difference of 0.090%).
| Demographics | Rating | Rank | Female Poverty Among 18-24 Year Olds |
| Immigrants | Serbia | 97.1 /100 | #111 | Exceptional 19.2% |
| Immigrants | El Salvador | 96.5 /100 | #112 | Exceptional 19.3% |
| Immigrants | Cameroon | 96.3 /100 | #113 | Exceptional 19.3% |
| Slovenes | 96.2 /100 | #114 | Exceptional 19.3% |
| Immigrants | Hungary | 96.2 /100 | #115 | Exceptional 19.3% |
| Immigrants | Immigrants | 95.9 /100 | #116 | Exceptional 19.3% |
| Immigrants | Iran | 95.8 /100 | #117 | Exceptional 19.3% |
| Immigrants | Guyana | 95.6 /100 | #118 | Exceptional 19.3% |
| Cypriots | 95.5 /100 | #119 | Exceptional 19.3% |
| Immigrants | Northern Europe | 95.4 /100 | #120 | Exceptional 19.4% |
| Guyanese | 95.3 /100 | #121 | Exceptional 19.4% |
| Cambodians | 94.6 /100 | #122 | Exceptional 19.4% |
| Paraguayans | 94.6 /100 | #123 | Exceptional 19.4% |
| Immigrants | Chile | 94.3 /100 | #124 | Exceptional 19.4% |
| Immigrants | Panama | 94.0 /100 | #125 | Exceptional 19.4% |
Demographics Similar to Spanish Americans by Female Poverty Among 18-24 Year Olds
In terms of female poverty among 18-24 year olds, the demographic groups most similar to Spanish Americans are Immigrants from Dominica (21.9%, a difference of 0.010%), Immigrants from Dominican Republic (21.9%, a difference of 0.050%), Bermudan (21.9%, a difference of 0.14%), Yaqui (21.9%, a difference of 0.17%), and Immigrants from Switzerland (21.8%, a difference of 0.43%).
| Demographics | Rating | Rank | Female Poverty Among 18-24 Year Olds |
| Basques | 0.2 /100 | #272 | Tragic 21.7% |
| New Zealanders | 0.2 /100 | #273 | Tragic 21.7% |
| Immigrants | Honduras | 0.1 /100 | #274 | Tragic 21.8% |
| Immigrants | Bangladesh | 0.1 /100 | #275 | Tragic 21.8% |
| Bahamians | 0.1 /100 | #276 | Tragic 21.8% |
| Immigrants | Switzerland | 0.1 /100 | #277 | Tragic 21.8% |
| Yaqui | 0.1 /100 | #278 | Tragic 21.9% |
| Spanish Americans | 0.1 /100 | #279 | Tragic 21.9% |
| Immigrants | Dominica | 0.1 /100 | #280 | Tragic 21.9% |
| Immigrants | Dominican Republic | 0.1 /100 | #281 | Tragic 21.9% |
| Bermudans | 0.1 /100 | #282 | Tragic 21.9% |
| Sub-Saharan Africans | 0.0 /100 | #283 | Tragic 22.0% |
| Tlingit-Haida | 0.0 /100 | #284 | Tragic 22.0% |
| Ottawa | 0.0 /100 | #285 | Tragic 22.0% |
| Ugandans | 0.0 /100 | #286 | Tragic 22.1% |