Immigrants from Guyana vs Immigrants from Bangladesh Child Poverty Under the Age of 16
COMPARE
Immigrants from Guyana
Immigrants from Bangladesh
Child Poverty Under the Age of 16
Child Poverty Under the Age of 16 Comparison
Immigrants from Guyana
Immigrants from Bangladesh
19.4%
CHILD POVERTY UNDER THE AGE OF 16
0.1/ 100
METRIC RATING
262nd/ 347
METRIC RANK
19.8%
CHILD POVERTY UNDER THE AGE OF 16
0.1/ 100
METRIC RATING
272nd/ 347
METRIC RANK
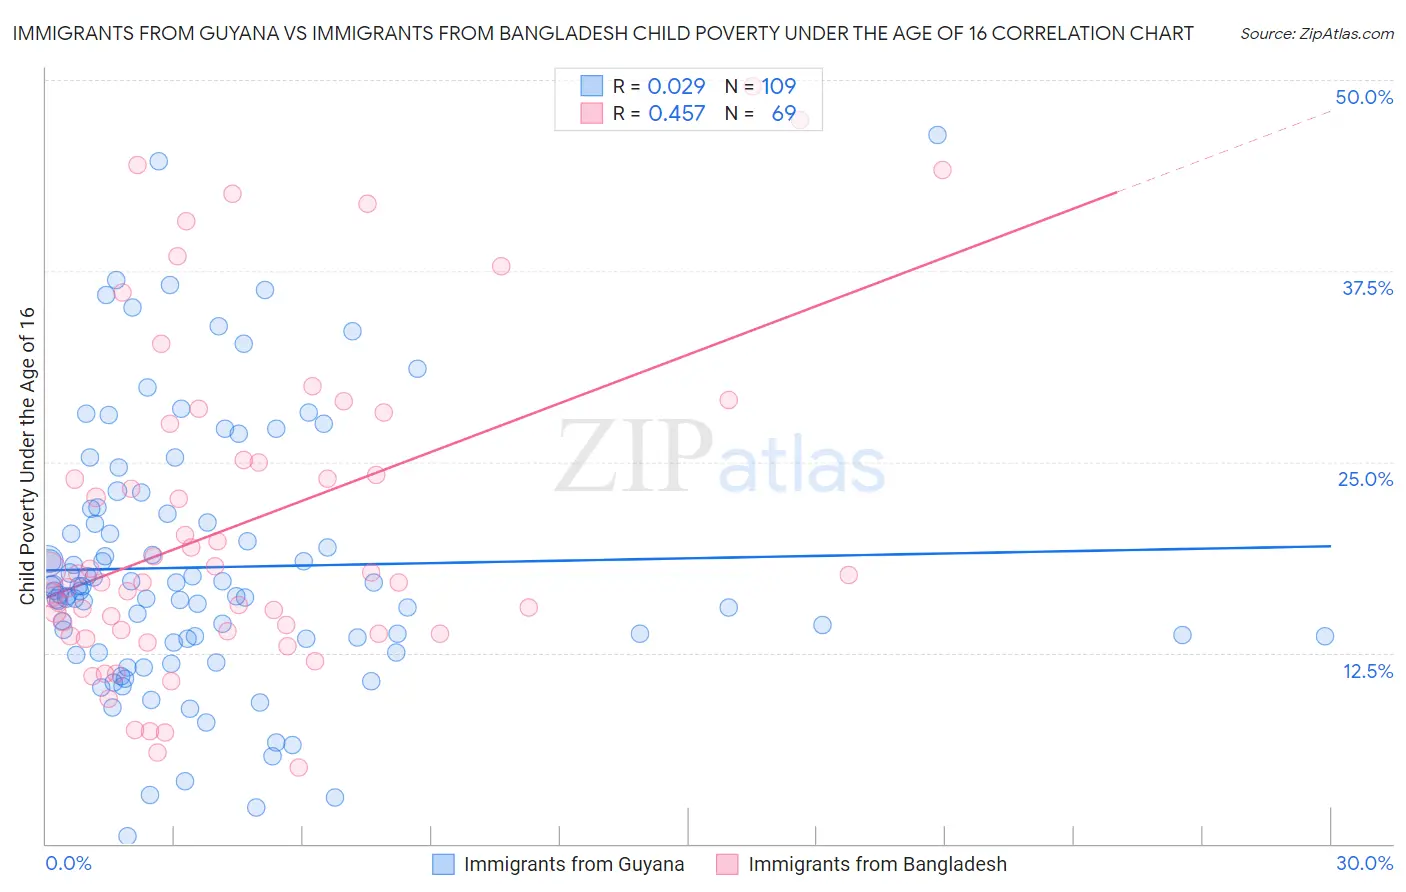
Immigrants from Guyana vs Immigrants from Bangladesh Child Poverty Under the Age of 16 Correlation Chart
The statistical analysis conducted on geographies consisting of 182,901,367 people shows no correlation between the proportion of Immigrants from Guyana and poverty level among children under the age of 16 in the United States with a correlation coefficient (R) of 0.029 and weighted average of 19.4%. Similarly, the statistical analysis conducted on geographies consisting of 202,953,129 people shows a moderate positive correlation between the proportion of Immigrants from Bangladesh and poverty level among children under the age of 16 in the United States with a correlation coefficient (R) of 0.457 and weighted average of 19.8%, a difference of 2.1%.
Child Poverty Under the Age of 16 Correlation Summary
| Measurement | Immigrants from Guyana | Immigrants from Bangladesh |
| Minimum | 0.46% | 5.0% |
| Maximum | 46.4% | 49.6% |
| Range | 45.9% | 44.6% |
| Mean | 18.1% | 21.0% |
| Median | 16.5% | 17.6% |
| Interquartile 25% (IQ1) | 13.3% | 13.8% |
| Interquartile 75% (IQ3) | 21.7% | 26.3% |
| Interquartile Range (IQR) | 8.5% | 12.5% |
| Standard Deviation (Sample) | 8.7% | 10.7% |
| Standard Deviation (Population) | 8.6% | 10.7% |
Demographics Similar to Immigrants from Guyana and Immigrants from Bangladesh by Child Poverty Under the Age of 16
In terms of child poverty under the age of 16, the demographic groups most similar to Immigrants from Guyana are Immigrants from Burma/Myanmar (19.4%, a difference of 0.040%), Guyanese (19.3%, a difference of 0.12%), Mexican American Indian (19.3%, a difference of 0.22%), Vietnamese (19.4%, a difference of 0.32%), and Immigrants from Ecuador (19.4%, a difference of 0.38%). Similarly, the demographic groups most similar to Immigrants from Bangladesh are Immigrants from Jamaica (19.8%, a difference of 0.24%), Immigrants from Liberia (19.7%, a difference of 0.31%), Immigrants from Cabo Verde (19.9%, a difference of 0.39%), Immigrants from Barbados (19.9%, a difference of 0.40%), and Belizean (19.9%, a difference of 0.40%).
| Demographics | Rating | Rank | Child Poverty Under the Age of 16 |
| Ottawa | 0.2 /100 | #257 | Tragic 19.2% |
| Spanish Americans | 0.2 /100 | #258 | Tragic 19.2% |
| Mexican American Indians | 0.2 /100 | #259 | Tragic 19.3% |
| Guyanese | 0.2 /100 | #260 | Tragic 19.3% |
| Immigrants | Burma/Myanmar | 0.1 /100 | #261 | Tragic 19.4% |
| Immigrants | Guyana | 0.1 /100 | #262 | Tragic 19.4% |
| Vietnamese | 0.1 /100 | #263 | Tragic 19.4% |
| Immigrants | Ecuador | 0.1 /100 | #264 | Tragic 19.4% |
| Chickasaw | 0.1 /100 | #265 | Tragic 19.5% |
| Liberians | 0.1 /100 | #266 | Tragic 19.5% |
| Cherokee | 0.1 /100 | #267 | Tragic 19.5% |
| Jamaicans | 0.1 /100 | #268 | Tragic 19.7% |
| Immigrants | El Salvador | 0.1 /100 | #269 | Tragic 19.7% |
| Spanish American Indians | 0.1 /100 | #270 | Tragic 19.7% |
| Immigrants | Liberia | 0.1 /100 | #271 | Tragic 19.7% |
| Immigrants | Bangladesh | 0.1 /100 | #272 | Tragic 19.8% |
| Immigrants | Jamaica | 0.1 /100 | #273 | Tragic 19.8% |
| Immigrants | Cabo Verde | 0.1 /100 | #274 | Tragic 19.9% |
| Immigrants | Barbados | 0.1 /100 | #275 | Tragic 19.9% |
| Belizeans | 0.1 /100 | #276 | Tragic 19.9% |
| Iroquois | 0.1 /100 | #277 | Tragic 19.9% |