Immigrants from Guatemala vs Carpatho Rusyn Receiving Food Stamps
COMPARE
Immigrants from Guatemala
Carpatho Rusyn
Receiving Food Stamps
Receiving Food Stamps Comparison
Immigrants from Guatemala
Carpatho Rusyns
14.6%
RECEIVING FOOD STAMPS
0.1/ 100
METRIC RATING
271st/ 347
METRIC RANK
10.4%
RECEIVING FOOD STAMPS
96.2/ 100
METRIC RATING
108th/ 347
METRIC RANK
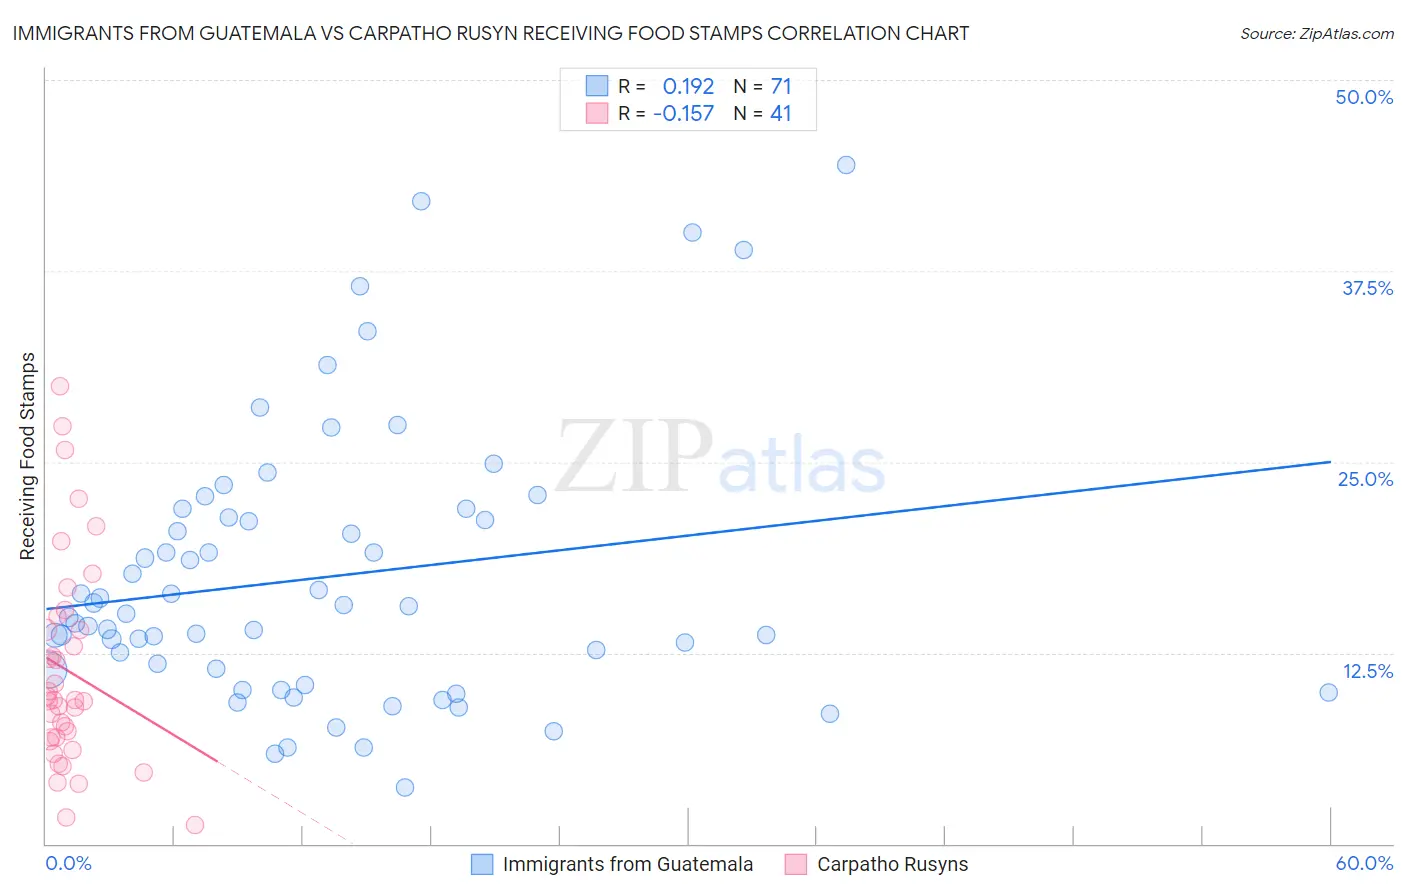
Immigrants from Guatemala vs Carpatho Rusyn Receiving Food Stamps Correlation Chart
The statistical analysis conducted on geographies consisting of 376,736,274 people shows a poor positive correlation between the proportion of Immigrants from Guatemala and percentage of population receiving government assistance and/or food stamps in the United States with a correlation coefficient (R) of 0.192 and weighted average of 14.6%. Similarly, the statistical analysis conducted on geographies consisting of 58,758,722 people shows a poor negative correlation between the proportion of Carpatho Rusyns and percentage of population receiving government assistance and/or food stamps in the United States with a correlation coefficient (R) of -0.157 and weighted average of 10.4%, a difference of 40.8%.
Receiving Food Stamps Correlation Summary
| Measurement | Immigrants from Guatemala | Carpatho Rusyn |
| Minimum | 3.7% | 1.2% |
| Maximum | 44.4% | 29.9% |
| Range | 40.7% | 28.7% |
| Mean | 17.4% | 11.3% |
| Median | 15.1% | 9.4% |
| Interquartile 25% (IQ1) | 11.4% | 6.8% |
| Interquartile 75% (IQ3) | 21.3% | 14.4% |
| Interquartile Range (IQR) | 10.0% | 7.6% |
| Standard Deviation (Sample) | 8.9% | 6.8% |
| Standard Deviation (Population) | 8.8% | 6.7% |
Similar Demographics by Receiving Food Stamps
Demographics Similar to Immigrants from Guatemala by Receiving Food Stamps
In terms of receiving food stamps, the demographic groups most similar to Immigrants from Guatemala are Mexican (14.6%, a difference of 0.090%), Chippewa (14.7%, a difference of 0.22%), Alaskan Athabascan (14.7%, a difference of 0.25%), Immigrants from Western Africa (14.7%, a difference of 0.27%), and Nepalese (14.6%, a difference of 0.30%).
| Demographics | Rating | Rank | Receiving Food Stamps |
| Immigrants | Uzbekistan | 0.2 /100 | #264 | Tragic 14.3% |
| Blackfeet | 0.2 /100 | #265 | Tragic 14.3% |
| Cheyenne | 0.2 /100 | #266 | Tragic 14.3% |
| Dutch West Indians | 0.2 /100 | #267 | Tragic 14.3% |
| Guatemalans | 0.1 /100 | #268 | Tragic 14.4% |
| Nepalese | 0.1 /100 | #269 | Tragic 14.6% |
| Mexicans | 0.1 /100 | #270 | Tragic 14.6% |
| Immigrants | Guatemala | 0.1 /100 | #271 | Tragic 14.6% |
| Chippewa | 0.1 /100 | #272 | Tragic 14.7% |
| Alaskan Athabascans | 0.1 /100 | #273 | Tragic 14.7% |
| Immigrants | Western Africa | 0.1 /100 | #274 | Tragic 14.7% |
| Ute | 0.1 /100 | #275 | Tragic 14.7% |
| Liberians | 0.1 /100 | #276 | Tragic 14.8% |
| Seminole | 0.1 /100 | #277 | Tragic 14.8% |
| Belizeans | 0.1 /100 | #278 | Tragic 14.8% |
Demographics Similar to Carpatho Rusyns by Receiving Food Stamps
In terms of receiving food stamps, the demographic groups most similar to Carpatho Rusyns are Korean (10.4%, a difference of 0.030%), Immigrants from Pakistan (10.4%, a difference of 0.040%), Immigrants from Italy (10.4%, a difference of 0.19%), Immigrants from Malaysia (10.4%, a difference of 0.27%), and Pakistani (10.4%, a difference of 0.33%).
| Demographics | Rating | Rank | Receiving Food Stamps |
| Palestinians | 96.9 /100 | #101 | Exceptional 10.3% |
| Immigrants | Europe | 96.8 /100 | #102 | Exceptional 10.3% |
| Immigrants | Latvia | 96.8 /100 | #103 | Exceptional 10.3% |
| Immigrants | Hungary | 96.7 /100 | #104 | Exceptional 10.3% |
| Immigrants | Malaysia | 96.5 /100 | #105 | Exceptional 10.4% |
| Immigrants | Italy | 96.4 /100 | #106 | Exceptional 10.4% |
| Koreans | 96.3 /100 | #107 | Exceptional 10.4% |
| Carpatho Rusyns | 96.2 /100 | #108 | Exceptional 10.4% |
| Immigrants | Pakistan | 96.2 /100 | #109 | Exceptional 10.4% |
| Pakistanis | 95.9 /100 | #110 | Exceptional 10.4% |
| Romanians | 95.8 /100 | #111 | Exceptional 10.4% |
| Mongolians | 95.8 /100 | #112 | Exceptional 10.5% |
| Icelanders | 95.4 /100 | #113 | Exceptional 10.5% |
| Scotch-Irish | 95.1 /100 | #114 | Exceptional 10.5% |
| Immigrants | Saudi Arabia | 94.9 /100 | #115 | Exceptional 10.5% |