Immigrants from Grenada vs Ute Family Poverty

COMPARE

Immigrants from Grenada
Race
Ancestry
AfghanAfricanAlaska NativeAlaskan AthabascanAlbanianAleutAlsatianAmericanApacheArabArapahoArgentineanArmenianAssyrian/Chaldean/SyriacAustralianAustrianBahamianBangladeshiBarbadianBasqueBelgianBelizeanBermudanBhutaneseBlackfeetBolivianBrazilianBritishBritish West IndianBulgarianBurmeseCajunCambodianCanadianCape VerdeanCarpatho RusynCelticCentral AmericanCentral American IndianCherokeeCheyenneChickasawChileanChineseChippewaChoctawColombianColvilleComancheCosta RicanCreeCreekCroatianCrowCubanCypriotCzechCzechoslovakianDanishDelawareDominicanDutchDutch West IndianEastern EuropeanEcuadorianEgyptianEnglishEstonianEthiopianEuropeanFijianFilipinoFinnishFrenchFrench American IndianFrench CanadianGermanGerman RussianGhanaianGreekGuamanian/ChamorroGuatemalanGuyaneseHaitianHmongHonduranHopiHoumaHungarianIcelanderIndian (Asian)IndonesianInupiatIranianIraqiIrishIroquoisIsraeliItalianJamaicanJapaneseJordanianKenyanKiowaKoreanLaotianLatvianLebaneseLiberianLithuanianLumbeeLuxembourgerMacedonianMalaysianMalteseMarshalleseMenomineeMexicanMexican American IndianMongolianMoroccanNative HawaiianNavajoNepaleseNew ZealanderNicaraguanNigerianNorthern EuropeanNorwegianOkinawanOsageOttawaPaiutePakistaniPalestinianPanamanianParaguayanPennsylvania GermanPeruvianPimaPolishPortuguesePotawatomiPuebloPuerto RicanPuget Sound SalishRomanianRussianSalvadoranSamoanScandinavianScotch-IrishScottishSeminoleSenegaleseSerbianShoshoneSierra LeoneanSiouxSlavicSlovakSloveneSomaliSouth AfricanSouth AmericanSouth American IndianSoviet UnionSpaniardSpanishSpanish AmericanSpanish American IndianSri LankanSubsaharan AfricanSudaneseSwedishSwissSyrianTaiwaneseThaiTlingit-HaidaTohono O'OdhamTonganTrinidadian and TobagonianTsimshianTurkishU.S. Virgin IslanderUgandanUkrainianUruguayanVenezuelanVietnameseWelshWest IndianYakamaYaquiYugoslavianYumanYup'ikZimbabwean
Immigration
NonimmigrantsImmigrantsAfghanistanAfricaAlbaniaArgentinaArmeniaAsiaAustraliaAustriaBahamasBangladeshBarbadosBelarusBelgiumBelizeBoliviaBosnia and HerzegovinaBrazilBulgariaBurma/MyanmarCabo VerdeCambodiaCameroonCanadaCaribbeanCentral AmericaChileChinaColombiaCongoCosta RicaCroatiaCubaCzechoslovakiaDenmarkDominicaDominican RepublicEastern AfricaEastern AsiaEastern EuropeEcuadorEgyptEl SalvadorEnglandEritreaEthiopiaEuropeFijiFranceGermanyGhanaGreeceGrenadaGuatemalaGuyanaHaitiHondurasHong KongHungaryIndiaIndonesiaIranIraqIrelandIsraelItalyJamaicaJapanJordanKazakhstanKenyaKoreaKuwaitLaosLatin AmericaLatviaLebanonLiberiaLithuaniaMalaysiaMexicoMicronesiaMiddle AfricaMoldovaMoroccoNepalNetherlandsNicaraguaNigeriaNorth AmericaNorth MacedoniaNorthern AfricaNorthern EuropeNorwayOceaniaPakistanPanamaPeruPhilippinesPolandPortugalRomaniaRussiaSaudi ArabiaScotlandSenegalSerbiaSierra LeoneSingaporeSomaliaSouth AfricaSouth AmericaSouth Central AsiaSouth Eastern AsiaSouthern EuropeSpainSri LankaSt. Vincent and the GrenadinesSudanSwedenSwitzerlandSyriaTaiwanThailandTrinidad and TobagoTurkeyUgandaUkraineUruguayUzbekistanVenezuelaVietnamWest IndiesWestern AfricaWestern AsiaWestern EuropeYemenZaireZimbabweAzores
Ute
Race
Ancestry
AfghanAfricanAlaska NativeAlaskan AthabascanAlbanianAleutAlsatianAmericanApacheArabArapahoArgentineanArmenianAssyrian/Chaldean/SyriacAustralianAustrianBahamianBangladeshiBarbadianBasqueBelgianBelizeanBermudanBhutaneseBlackfeetBolivianBrazilianBritishBritish West IndianBulgarianBurmeseCajunCambodianCanadianCape VerdeanCarpatho RusynCelticCentral AmericanCentral American IndianCherokeeCheyenneChickasawChileanChineseChippewaChoctawColombianColvilleComancheCosta RicanCreeCreekCroatianCrowCubanCypriotCzechCzechoslovakianDanishDelawareDominicanDutchDutch West IndianEastern EuropeanEcuadorianEgyptianEnglishEstonianEthiopianEuropeanFijianFilipinoFinnishFrenchFrench American IndianFrench CanadianGermanGerman RussianGhanaianGreekGuamanian/ChamorroGuatemalanGuyaneseHaitianHmongHonduranHopiHoumaHungarianIcelanderIndian (Asian)IndonesianInupiatIranianIraqiIrishIroquoisIsraeliItalianJamaicanJapaneseJordanianKenyanKiowaKoreanLaotianLatvianLebaneseLiberianLithuanianLumbeeLuxembourgerMacedonianMalaysianMalteseMarshalleseMenomineeMexicanMexican American IndianMongolianMoroccanNative HawaiianNavajoNepaleseNew ZealanderNicaraguanNigerianNorthern EuropeanNorwegianOkinawanOsageOttawaPaiutePakistaniPalestinianPanamanianParaguayanPennsylvania GermanPeruvianPimaPolishPortuguesePotawatomiPuebloPuerto RicanPuget Sound SalishRomanianRussianSalvadoranSamoanScandinavianScotch-IrishScottishSeminoleSenegaleseSerbianShoshoneSierra LeoneanSiouxSlavicSlovakSloveneSomaliSouth AfricanSouth AmericanSouth American IndianSoviet UnionSpaniardSpanishSpanish AmericanSpanish American IndianSri LankanSubsaharan AfricanSudaneseSwedishSwissSyrianTaiwaneseThaiTlingit-HaidaTohono O'OdhamTonganTrinidadian and TobagonianTsimshianTurkishU.S. Virgin IslanderUgandanUkrainianUruguayanUteVenezuelanVietnameseWelshWest IndianYakamaYaquiYugoslavianYumanYup'ikZimbabwean
Immigration
NonimmigrantsImmigrantsAfghanistanAfricaAlbaniaArgentinaArmeniaAsiaAustraliaAustriaBahamasBangladeshBarbadosBelarusBelgiumBelizeBoliviaBosnia and HerzegovinaBrazilBulgariaBurma/MyanmarCabo VerdeCambodiaCameroonCanadaCaribbeanCentral AmericaChileChinaColombiaCongoCosta RicaCroatiaCubaCzechoslovakiaDenmarkDominicaDominican RepublicEastern AfricaEastern AsiaEastern EuropeEcuadorEgyptEl SalvadorEnglandEritreaEthiopiaEuropeFijiFranceGermanyGhanaGreeceGuatemalaGuyanaHaitiHondurasHong KongHungaryIndiaIndonesiaIranIraqIrelandIsraelItalyJamaicaJapanJordanKazakhstanKenyaKoreaKuwaitLaosLatin AmericaLatviaLebanonLiberiaLithuaniaMalaysiaMexicoMicronesiaMiddle AfricaMoldovaMoroccoNepalNetherlandsNicaraguaNigeriaNorth AmericaNorth MacedoniaNorthern AfricaNorthern EuropeNorwayOceaniaPakistanPanamaPeruPhilippinesPolandPortugalRomaniaRussiaSaudi ArabiaScotlandSenegalSerbiaSierra LeoneSingaporeSomaliaSouth AfricaSouth AmericaSouth Central AsiaSouth Eastern AsiaSouthern EuropeSpainSri LankaSt. Vincent and the GrenadinesSudanSwedenSwitzerlandSyriaTaiwanThailandTrinidad and TobagoTurkeyUgandaUkraineUruguayUzbekistanVenezuelaVietnamWest IndiesWestern AfricaWestern AsiaWestern EuropeYemenZaireZimbabweAzores
Family Poverty
Income
Poverty
Unemployment
Labor Participation
Family Structure
Vehicle Availability
Education Level
Disability

Family Poverty Comparison

Immigrants from Grenada

Ute

Tragic
Tragic
12.4%
FAMILY POVERTY
0.0/ 100
METRIC RATING
317th/ 347
METRIC RANK
12.1%
FAMILY POVERTY
0.0/ 100
METRIC RATING
311th/ 347
METRIC RANK

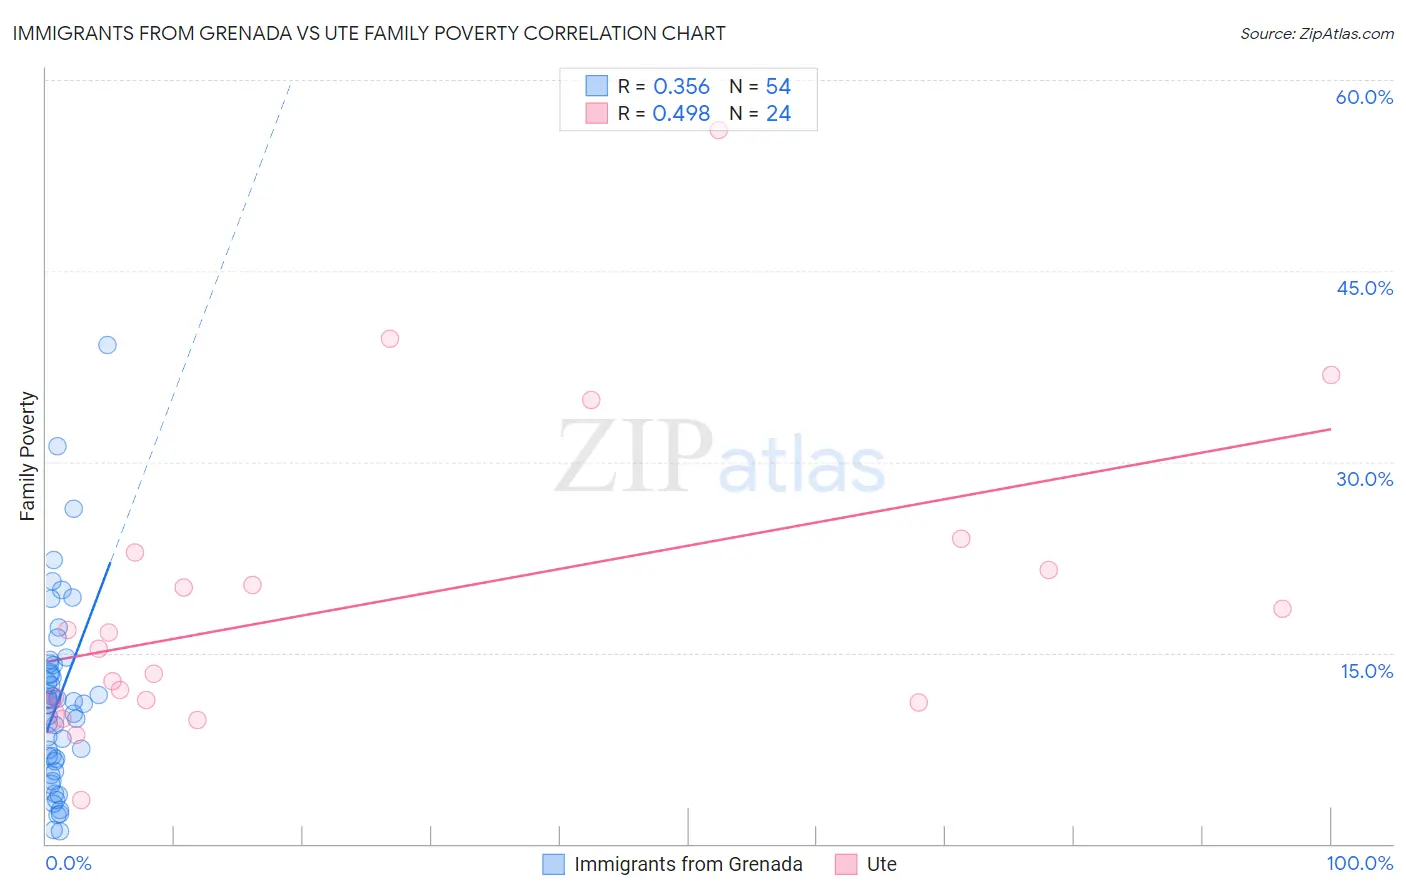
Immigrants from Grenada vs Ute Family Poverty Correlation Chart

The statistical analysis conducted on geographies consisting of 67,148,285 people shows a mild positive correlation between the proportion of Immigrants from Grenada and poverty level among families in the United States with a correlation coefficient (R) of 0.356 and weighted average of 12.4%. Similarly, the statistical analysis conducted on geographies consisting of 55,645,170 people shows a moderate positive correlation between the proportion of Ute and poverty level among families in the United States with a correlation coefficient (R) of 0.498 and weighted average of 12.1%, a difference of 2.8%.
Immigrants from Grenada vs Ute Family Poverty

Family Poverty Correlation Summary

MeasurementImmigrants from GrenadaUte
Minimum0.96%3.5%
Maximum39.2%56.1%
Range38.2%52.6%
Mean11.3%19.0%
Median11.0%15.9%
Interquartile 25% (IQ1)6.5%11.2%
Interquartile 75% (IQ3)14.1%22.2%
Interquartile Range (IQR)7.6%11.0%
Standard Deviation (Sample)7.4%12.1%
Standard Deviation (Population)7.3%11.8%

Demographics Similar to Immigrants from Grenada and Ute by Family Poverty

In terms of family poverty, the demographic groups most similar to Immigrants from Grenada are U.S. Virgin Islander (12.4%, a difference of 0.010%), British West Indian (12.4%, a difference of 0.060%), Honduran (12.4%, a difference of 0.22%), Inupiat (12.5%, a difference of 0.54%), and Immigrants from Mexico (12.3%, a difference of 0.96%). Similarly, the demographic groups most similar to Ute are Immigrants from Central America (12.1%, a difference of 0.38%), Hispanic or Latino (12.0%, a difference of 0.84%), Immigrants from Guatemala (12.0%, a difference of 0.84%), Immigrants from Caribbean (12.2%, a difference of 1.1%), and Seminole (11.9%, a difference of 1.3%).
DemographicsRating | RankFamily Poverty
Immigrants | Latin America
0.0
/100
|
#304
Tragic
11.8%
Mexicans
0.0
/100
|
#305
Tragic
11.8%
Cajuns
0.0
/100
|
#306
Tragic
11.9%
Immigrants | Congo
0.0
/100
|
#307
Tragic
11.9%
Seminole
0.0
/100
|
#308
Tragic
11.9%
Hispanics or Latinos
0.0
/100
|
#309
Tragic
12.0%
Immigrants | Guatemala
0.0
/100
|
#310
Tragic
12.0%
Ute
0.0
/100
|
#311
Tragic
12.1%
Immigrants | Central America
0.0
/100
|
#312
Tragic
12.1%
Immigrants | Caribbean
0.0
/100
|
#313
Tragic
12.2%
Kiowa
0.0
/100
|
#314
Tragic
12.2%
Immigrants | Mexico
0.0
/100
|
#315
Tragic
12.3%
Hondurans
0.0
/100
|
#316
Tragic
12.4%
Immigrants | Grenada
0.0
/100
|
#317
Tragic
12.4%
U.S. Virgin Islanders
0.0
/100
|
#318
Tragic
12.4%
British West Indians
0.0
/100
|
#319
Tragic
12.4%
Inupiat
0.0
/100
|
#320
Tragic
12.5%
Arapaho
0.0
/100
|
#321
Tragic
12.7%
Immigrants | Honduras
0.0
/100
|
#322
Tragic
12.7%
Menominee
0.0
/100
|
#323
Tragic
12.7%
Immigrants | Dominica
0.0
/100
|
#324
Tragic
12.7%