Immigrants from Greece vs Maltese Single Female Poverty
COMPARE
Immigrants from Greece
Maltese
Single Female Poverty
Single Female Poverty Comparison
Immigrants from Greece
Maltese
18.3%
SINGLE FEMALE POVERTY
100.0/ 100
METRIC RATING
20th/ 347
METRIC RANK
18.3%
SINGLE FEMALE POVERTY
100.0/ 100
METRIC RATING
21st/ 347
METRIC RANK
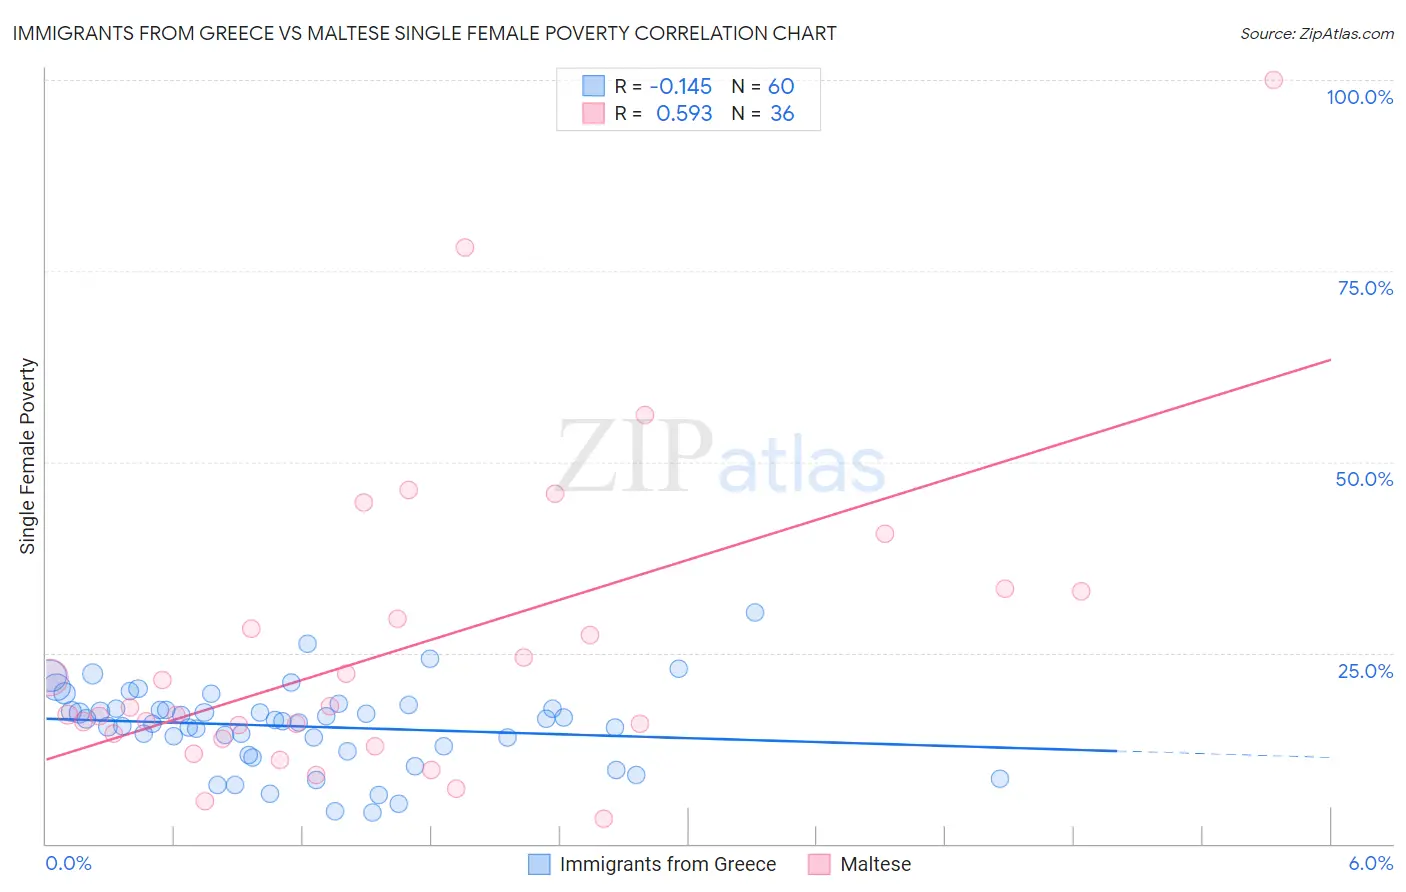
Immigrants from Greece vs Maltese Single Female Poverty Correlation Chart
The statistical analysis conducted on geographies consisting of 214,211,869 people shows a poor negative correlation between the proportion of Immigrants from Greece and poverty level among single females in the United States with a correlation coefficient (R) of -0.145 and weighted average of 18.3%. Similarly, the statistical analysis conducted on geographies consisting of 125,419,200 people shows a substantial positive correlation between the proportion of Maltese and poverty level among single females in the United States with a correlation coefficient (R) of 0.593 and weighted average of 18.3%, a difference of 0.060%.
Single Female Poverty Correlation Summary
| Measurement | Immigrants from Greece | Maltese |
| Minimum | 4.1% | 3.3% |
| Maximum | 30.3% | 100.0% |
| Range | 26.2% | 96.7% |
| Mean | 15.4% | 25.4% |
| Median | 16.1% | 17.4% |
| Interquartile 25% (IQ1) | 12.4% | 14.1% |
| Interquartile 75% (IQ3) | 17.7% | 31.2% |
| Interquartile Range (IQR) | 5.2% | 17.1% |
| Standard Deviation (Sample) | 5.3% | 20.2% |
| Standard Deviation (Population) | 5.3% | 19.9% |
Demographics Similar to Immigrants from Greece and Maltese by Single Female Poverty
In terms of single female poverty, the demographic groups most similar to Immigrants from Greece are Burmese (18.3%, a difference of 0.070%), Asian (18.3%, a difference of 0.070%), Armenian (18.3%, a difference of 0.30%), Immigrants from Singapore (18.3%, a difference of 0.40%), and Immigrants from Israel (18.3%, a difference of 0.42%). Similarly, the demographic groups most similar to Maltese are Burmese (18.3%, a difference of 0.010%), Asian (18.3%, a difference of 0.020%), Armenian (18.3%, a difference of 0.24%), Immigrants from Singapore (18.3%, a difference of 0.34%), and Immigrants from Israel (18.3%, a difference of 0.37%).
| Demographics | Rating | Rank | Single Female Poverty |
| Immigrants | Ireland | 100.0 /100 | #10 | Exceptional 17.8% |
| Immigrants | Lithuania | 100.0 /100 | #11 | Exceptional 17.8% |
| Immigrants | South Central Asia | 100.0 /100 | #12 | Exceptional 17.8% |
| Immigrants | Bolivia | 100.0 /100 | #13 | Exceptional 17.8% |
| Bolivians | 100.0 /100 | #14 | Exceptional 17.9% |
| Indians (Asian) | 100.0 /100 | #15 | Exceptional 17.9% |
| Iranians | 100.0 /100 | #16 | Exceptional 18.0% |
| Immigrants | Korea | 100.0 /100 | #17 | Exceptional 18.1% |
| Immigrants | Eastern Asia | 100.0 /100 | #18 | Exceptional 18.1% |
| Immigrants | China | 100.0 /100 | #19 | Exceptional 18.1% |
| Immigrants | Greece | 100.0 /100 | #20 | Exceptional 18.3% |
| Maltese | 100.0 /100 | #21 | Exceptional 18.3% |
| Burmese | 100.0 /100 | #22 | Exceptional 18.3% |
| Asians | 100.0 /100 | #23 | Exceptional 18.3% |
| Armenians | 100.0 /100 | #24 | Exceptional 18.3% |
| Immigrants | Singapore | 100.0 /100 | #25 | Exceptional 18.3% |
| Immigrants | Israel | 100.0 /100 | #26 | Exceptional 18.3% |
| Immigrants | Pakistan | 100.0 /100 | #27 | Exceptional 18.4% |
| Immigrants | Moldova | 100.0 /100 | #28 | Exceptional 18.5% |
| Immigrants | Poland | 100.0 /100 | #29 | Exceptional 18.5% |
| Immigrants | North Macedonia | 99.9 /100 | #30 | Exceptional 18.5% |