Immigrants from Greece vs Israeli Child Poverty Under the Age of 5
COMPARE
Immigrants from Greece
Israeli
Child Poverty Under the Age of 5
Child Poverty Under the Age of 5 Comparison
Immigrants from Greece
Israelis
14.7%
CHILD POVERTY UNDER THE AGE OF 5
99.7/ 100
METRIC RATING
43rd/ 347
METRIC RANK
16.6%
CHILD POVERTY UNDER THE AGE OF 5
82.0/ 100
METRIC RATING
146th/ 347
METRIC RANK
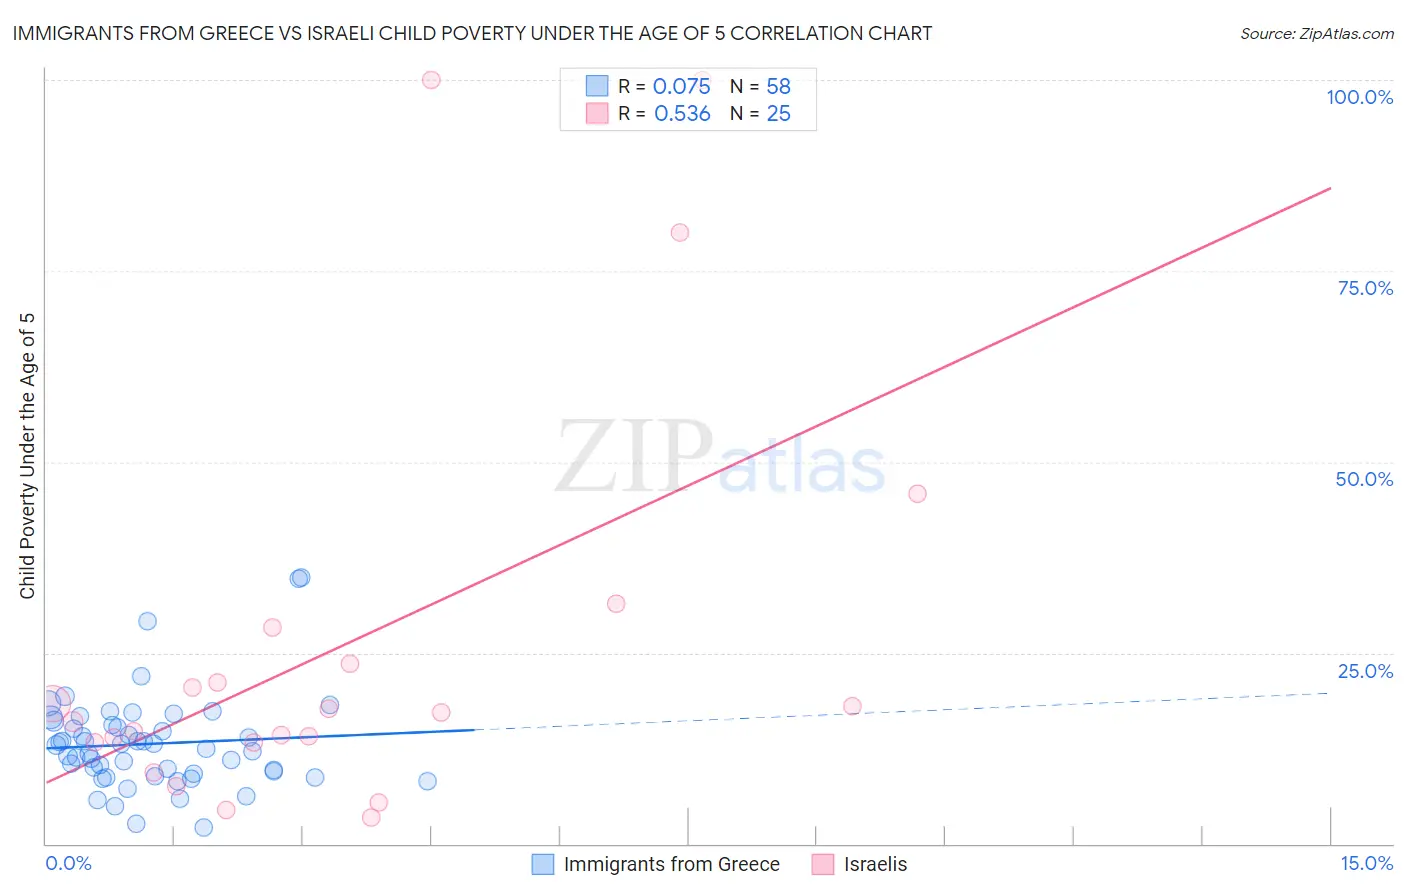
Immigrants from Greece vs Israeli Child Poverty Under the Age of 5 Correlation Chart
The statistical analysis conducted on geographies consisting of 208,661,628 people shows a slight positive correlation between the proportion of Immigrants from Greece and poverty level among children under the age of 5 in the United States with a correlation coefficient (R) of 0.075 and weighted average of 14.7%. Similarly, the statistical analysis conducted on geographies consisting of 203,705,718 people shows a substantial positive correlation between the proportion of Israelis and poverty level among children under the age of 5 in the United States with a correlation coefficient (R) of 0.536 and weighted average of 16.6%, a difference of 12.7%.
Child Poverty Under the Age of 5 Correlation Summary
| Measurement | Immigrants from Greece | Israeli |
| Minimum | 2.1% | 3.4% |
| Maximum | 34.8% | 100.0% |
| Range | 32.7% | 96.6% |
| Mean | 13.1% | 26.1% |
| Median | 12.7% | 17.2% |
| Interquartile 25% (IQ1) | 9.2% | 13.3% |
| Interquartile 75% (IQ3) | 15.5% | 25.9% |
| Interquartile Range (IQR) | 6.3% | 12.7% |
| Standard Deviation (Sample) | 6.2% | 27.1% |
| Standard Deviation (Population) | 6.2% | 26.5% |
Similar Demographics by Child Poverty Under the Age of 5
Demographics Similar to Immigrants from Greece by Child Poverty Under the Age of 5
In terms of child poverty under the age of 5, the demographic groups most similar to Immigrants from Greece are Soviet Union (14.7%, a difference of 0.0%), Immigrants from Philippines (14.7%, a difference of 0.13%), Immigrants from Belarus (14.7%, a difference of 0.16%), Laotian (14.7%, a difference of 0.26%), and Immigrants from Australia (14.6%, a difference of 0.28%).
| Demographics | Rating | Rank | Child Poverty Under the Age of 5 |
| Maltese | 99.8 /100 | #36 | Exceptional 14.5% |
| Turks | 99.7 /100 | #37 | Exceptional 14.6% |
| Eastern Europeans | 99.7 /100 | #38 | Exceptional 14.6% |
| Norwegians | 99.7 /100 | #39 | Exceptional 14.6% |
| Immigrants | Australia | 99.7 /100 | #40 | Exceptional 14.6% |
| Immigrants | Belarus | 99.7 /100 | #41 | Exceptional 14.7% |
| Soviet Union | 99.7 /100 | #42 | Exceptional 14.7% |
| Immigrants | Greece | 99.7 /100 | #43 | Exceptional 14.7% |
| Immigrants | Philippines | 99.7 /100 | #44 | Exceptional 14.7% |
| Laotians | 99.6 /100 | #45 | Exceptional 14.7% |
| Tsimshian | 99.6 /100 | #46 | Exceptional 14.7% |
| Russians | 99.6 /100 | #47 | Exceptional 14.8% |
| Immigrants | Czechoslovakia | 99.6 /100 | #48 | Exceptional 14.8% |
| Immigrants | Bulgaria | 99.6 /100 | #49 | Exceptional 14.8% |
| Immigrants | Northern Europe | 99.6 /100 | #50 | Exceptional 14.8% |
Demographics Similar to Israelis by Child Poverty Under the Age of 5
In terms of child poverty under the age of 5, the demographic groups most similar to Israelis are Immigrants from Ethiopia (16.6%, a difference of 0.020%), Ethiopian (16.5%, a difference of 0.12%), Samoan (16.5%, a difference of 0.18%), Portuguese (16.5%, a difference of 0.19%), and Immigrants from Western Europe (16.5%, a difference of 0.24%).
| Demographics | Rating | Rank | Child Poverty Under the Age of 5 |
| Immigrants | Hungary | 84.5 /100 | #139 | Excellent 16.5% |
| Guamanians/Chamorros | 84.2 /100 | #140 | Excellent 16.5% |
| Immigrants | Western Europe | 83.3 /100 | #141 | Excellent 16.5% |
| Portuguese | 83.0 /100 | #142 | Excellent 16.5% |
| Samoans | 83.0 /100 | #143 | Excellent 16.5% |
| Ethiopians | 82.7 /100 | #144 | Excellent 16.5% |
| Immigrants | Ethiopia | 82.1 /100 | #145 | Excellent 16.6% |
| Israelis | 82.0 /100 | #146 | Excellent 16.6% |
| Immigrants | Nepal | 80.3 /100 | #147 | Excellent 16.6% |
| Syrians | 79.1 /100 | #148 | Good 16.6% |
| New Zealanders | 78.7 /100 | #149 | Good 16.6% |
| Colombians | 77.8 /100 | #150 | Good 16.7% |
| Canadians | 77.6 /100 | #151 | Good 16.7% |
| Belgians | 77.2 /100 | #152 | Good 16.7% |
| Dutch | 77.1 /100 | #153 | Good 16.7% |