Immigrants from Ghana vs Haitian Single Female Poverty
COMPARE
Immigrants from Ghana
Haitian
Single Female Poverty
Single Female Poverty Comparison
Immigrants from Ghana
Haitians
21.9%
SINGLE FEMALE POVERTY
5.8/ 100
METRIC RATING
227th/ 347
METRIC RANK
21.6%
SINGLE FEMALE POVERTY
15.4/ 100
METRIC RATING
208th/ 347
METRIC RANK
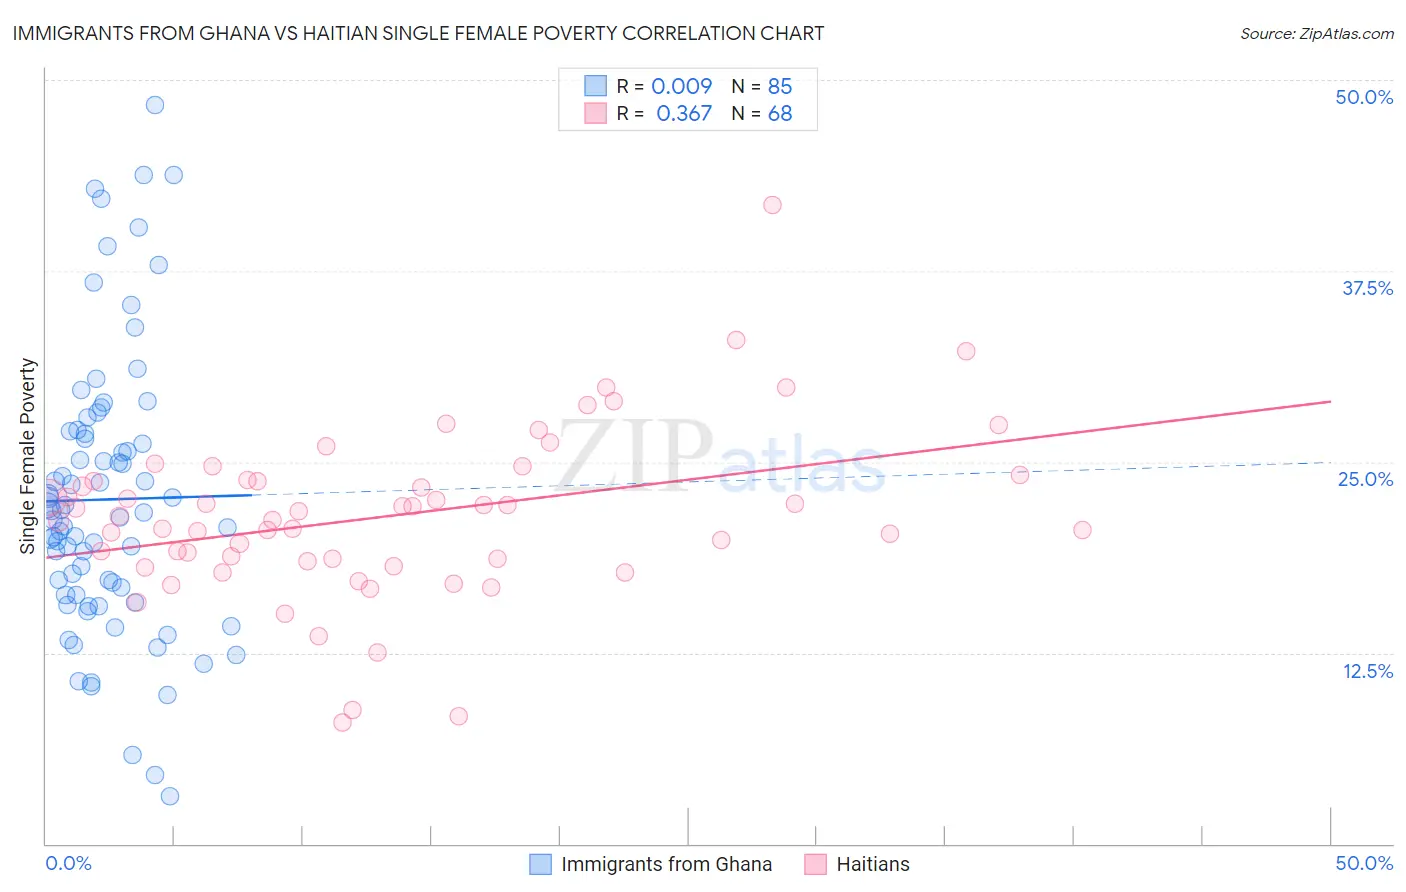
Immigrants from Ghana vs Haitian Single Female Poverty Correlation Chart
The statistical analysis conducted on geographies consisting of 198,608,893 people shows no correlation between the proportion of Immigrants from Ghana and poverty level among single females in the United States with a correlation coefficient (R) of 0.009 and weighted average of 21.9%. Similarly, the statistical analysis conducted on geographies consisting of 284,824,358 people shows a mild positive correlation between the proportion of Haitians and poverty level among single females in the United States with a correlation coefficient (R) of 0.367 and weighted average of 21.6%, a difference of 1.7%.
Single Female Poverty Correlation Summary
| Measurement | Immigrants from Ghana | Haitian |
| Minimum | 3.1% | 7.9% |
| Maximum | 48.4% | 41.8% |
| Range | 45.2% | 33.9% |
| Mean | 22.5% | 21.5% |
| Median | 21.7% | 21.3% |
| Interquartile 25% (IQ1) | 16.3% | 18.6% |
| Interquartile 75% (IQ3) | 26.9% | 23.8% |
| Interquartile Range (IQR) | 10.7% | 5.2% |
| Standard Deviation (Sample) | 9.2% | 5.6% |
| Standard Deviation (Population) | 9.1% | 5.5% |
Demographics Similar to Immigrants from Ghana and Haitians by Single Female Poverty
In terms of single female poverty, the demographic groups most similar to Immigrants from Ghana are Immigrants from Portugal (21.9%, a difference of 0.0%), English (21.9%, a difference of 0.16%), Barbadian (21.8%, a difference of 0.34%), Scottish (21.8%, a difference of 0.36%), and Immigrants from Eritrea (21.8%, a difference of 0.51%). Similarly, the demographic groups most similar to Haitians are Immigrants from Eastern Africa (21.6%, a difference of 0.030%), Ghanaian (21.6%, a difference of 0.040%), Immigrants from Panama (21.6%, a difference of 0.12%), Icelander (21.6%, a difference of 0.17%), and Jamaican (21.6%, a difference of 0.18%).
| Demographics | Rating | Rank | Single Female Poverty |
| Ghanaians | 15.7 /100 | #207 | Poor 21.6% |
| Haitians | 15.4 /100 | #208 | Poor 21.6% |
| Immigrants | Eastern Africa | 15.1 /100 | #209 | Poor 21.6% |
| Immigrants | Panama | 14.4 /100 | #210 | Poor 21.6% |
| Icelanders | 14.0 /100 | #211 | Poor 21.6% |
| Jamaicans | 14.0 /100 | #212 | Poor 21.6% |
| Guamanians/Chamorros | 13.7 /100 | #213 | Poor 21.6% |
| Immigrants | Nicaragua | 13.3 /100 | #214 | Poor 21.6% |
| Ecuadorians | 12.3 /100 | #215 | Poor 21.6% |
| Immigrants | Barbados | 12.2 /100 | #216 | Poor 21.7% |
| Immigrants | St. Vincent and the Grenadines | 11.7 /100 | #217 | Poor 21.7% |
| Nepalese | 9.7 /100 | #218 | Tragic 21.7% |
| Panamanians | 9.4 /100 | #219 | Tragic 21.7% |
| Germans | 8.3 /100 | #220 | Tragic 21.8% |
| Immigrants | Grenada | 8.0 /100 | #221 | Tragic 21.8% |
| Immigrants | Eritrea | 7.9 /100 | #222 | Tragic 21.8% |
| Scottish | 7.3 /100 | #223 | Tragic 21.8% |
| Barbadians | 7.2 /100 | #224 | Tragic 21.8% |
| English | 6.4 /100 | #225 | Tragic 21.9% |
| Immigrants | Portugal | 5.8 /100 | #226 | Tragic 21.9% |
| Immigrants | Ghana | 5.8 /100 | #227 | Tragic 21.9% |