Immigrants from Germany vs Immigrants from Uganda Single Father Poverty
COMPARE
Immigrants from Germany
Immigrants from Uganda
Single Father Poverty
Single Father Poverty Comparison
Immigrants from Germany
Immigrants from Uganda
16.9%
SINGLE FATHER POVERTY
2.9/ 100
METRIC RATING
236th/ 347
METRIC RANK
16.7%
SINGLE FATHER POVERTY
8.6/ 100
METRIC RATING
218th/ 347
METRIC RANK
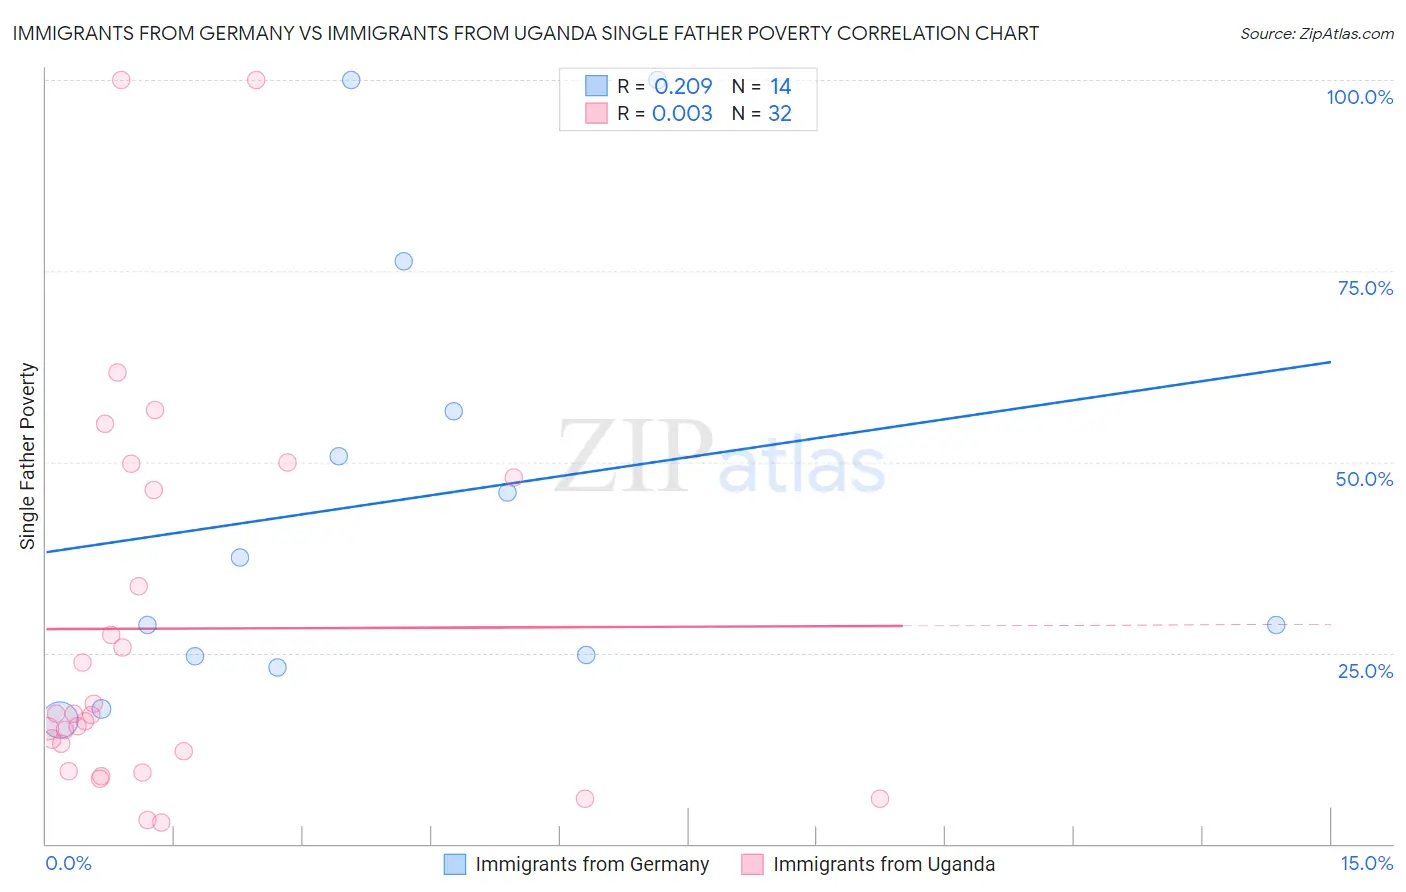
Immigrants from Germany vs Immigrants from Uganda Single Father Poverty Correlation Chart
The statistical analysis conducted on geographies consisting of 353,765,959 people shows a weak positive correlation between the proportion of Immigrants from Germany and poverty level among single fathers in the United States with a correlation coefficient (R) of 0.209 and weighted average of 16.9%. Similarly, the statistical analysis conducted on geographies consisting of 112,192,123 people shows no correlation between the proportion of Immigrants from Uganda and poverty level among single fathers in the United States with a correlation coefficient (R) of 0.003 and weighted average of 16.7%, a difference of 1.2%.
Single Father Poverty Correlation Summary
| Measurement | Immigrants from Germany | Immigrants from Uganda |
| Minimum | 16.1% | 2.8% |
| Maximum | 100.0% | 100.0% |
| Range | 83.9% | 97.2% |
| Mean | 45.0% | 28.2% |
| Median | 33.0% | 16.9% |
| Interquartile 25% (IQ1) | 24.6% | 10.8% |
| Interquartile 75% (IQ3) | 56.6% | 47.1% |
| Interquartile Range (IQR) | 32.0% | 36.3% |
| Standard Deviation (Sample) | 28.7% | 25.6% |
| Standard Deviation (Population) | 27.6% | 25.2% |
Demographics Similar to Immigrants from Germany and Immigrants from Uganda by Single Father Poverty
In terms of single father poverty, the demographic groups most similar to Immigrants from Germany are Immigrants from Western Europe (16.9%, a difference of 0.0%), Subsaharan African (16.9%, a difference of 0.0%), Marshallese (16.9%, a difference of 0.10%), Senegalese (16.9%, a difference of 0.12%), and Immigrants from Grenada (16.9%, a difference of 0.27%). Similarly, the demographic groups most similar to Immigrants from Uganda are Immigrants from Ghana (16.7%, a difference of 0.060%), Immigrants from Denmark (16.7%, a difference of 0.070%), Immigrants from Greece (16.7%, a difference of 0.070%), Immigrants from Spain (16.7%, a difference of 0.070%), and Cheyenne (16.7%, a difference of 0.10%).
| Demographics | Rating | Rank | Single Father Poverty |
| Cheyenne | 9.3 /100 | #217 | Tragic 16.7% |
| Immigrants | Uganda | 8.6 /100 | #218 | Tragic 16.7% |
| Immigrants | Ghana | 8.1 /100 | #219 | Tragic 16.7% |
| Immigrants | Denmark | 8.1 /100 | #220 | Tragic 16.7% |
| Immigrants | Greece | 8.1 /100 | #221 | Tragic 16.7% |
| Immigrants | Spain | 8.0 /100 | #222 | Tragic 16.7% |
| Immigrants | Austria | 7.0 /100 | #223 | Tragic 16.8% |
| Immigrants | Norway | 6.5 /100 | #224 | Tragic 16.8% |
| Menominee | 6.4 /100 | #225 | Tragic 16.8% |
| Hispanics or Latinos | 6.1 /100 | #226 | Tragic 16.8% |
| British | 5.6 /100 | #227 | Tragic 16.8% |
| Belgians | 5.3 /100 | #228 | Tragic 16.8% |
| Israelis | 4.6 /100 | #229 | Tragic 16.8% |
| Immigrants | Trinidad and Tobago | 4.5 /100 | #230 | Tragic 16.8% |
| Spanish Americans | 3.7 /100 | #231 | Tragic 16.9% |
| Immigrants | Grenada | 3.7 /100 | #232 | Tragic 16.9% |
| Senegalese | 3.2 /100 | #233 | Tragic 16.9% |
| Marshallese | 3.1 /100 | #234 | Tragic 16.9% |
| Immigrants | Western Europe | 2.9 /100 | #235 | Tragic 16.9% |
| Immigrants | Germany | 2.9 /100 | #236 | Tragic 16.9% |
| Sub-Saharan Africans | 2.9 /100 | #237 | Tragic 16.9% |