Immigrants from Germany vs Immigrants from Jamaica Child Poverty Under the Age of 5
COMPARE
Immigrants from Germany
Immigrants from Jamaica
Child Poverty Under the Age of 5
Child Poverty Under the Age of 5 Comparison
Immigrants from Germany
Immigrants from Jamaica
17.4%
CHILD POVERTY UNDER THE AGE OF 5
41.0/ 100
METRIC RATING
181st/ 347
METRIC RANK
20.5%
CHILD POVERTY UNDER THE AGE OF 5
0.1/ 100
METRIC RATING
272nd/ 347
METRIC RANK
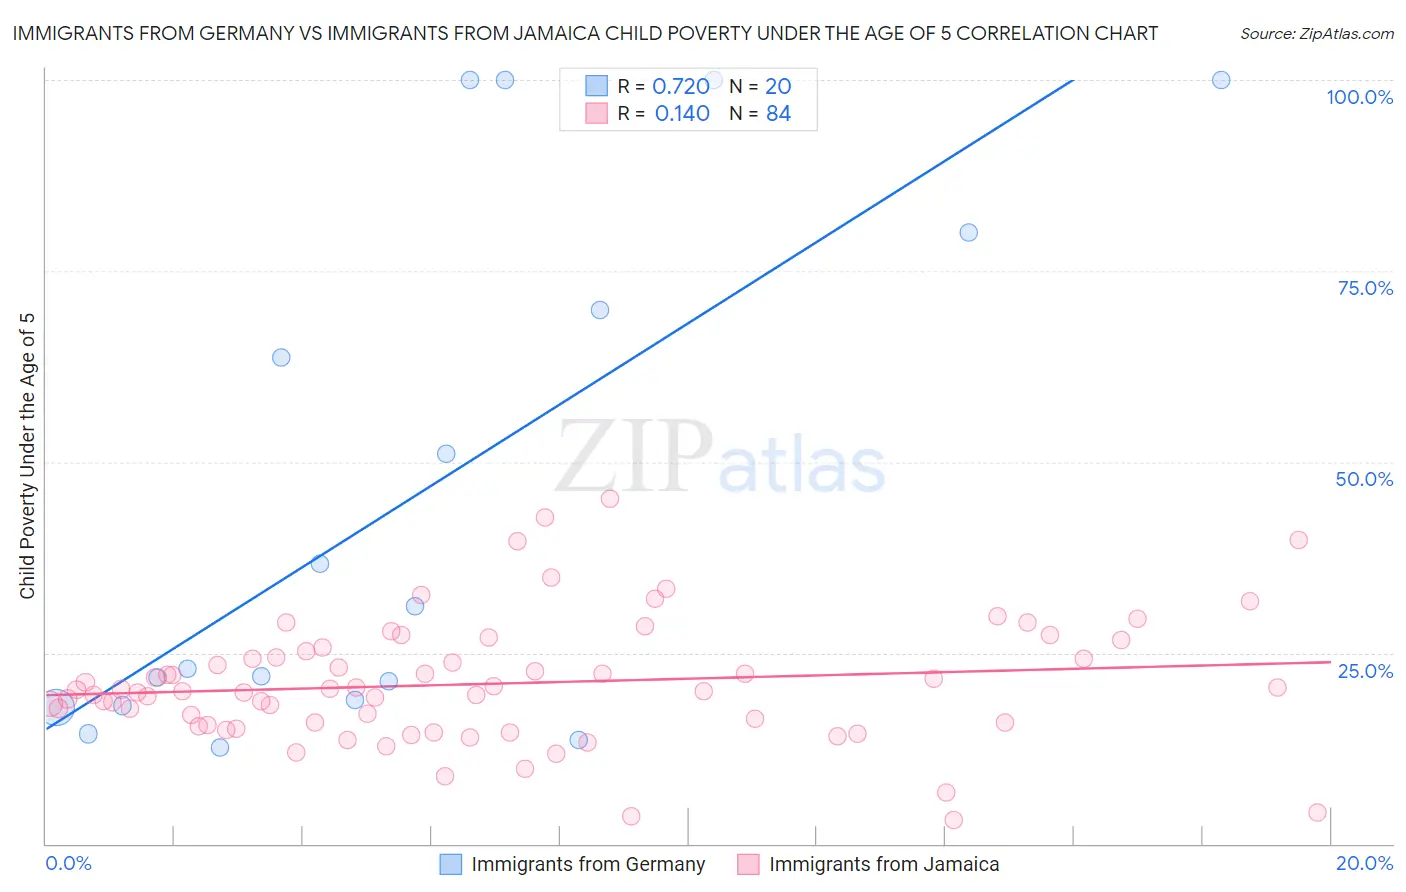
Immigrants from Germany vs Immigrants from Jamaica Child Poverty Under the Age of 5 Correlation Chart
The statistical analysis conducted on geographies consisting of 440,983,234 people shows a strong positive correlation between the proportion of Immigrants from Germany and poverty level among children under the age of 5 in the United States with a correlation coefficient (R) of 0.720 and weighted average of 17.4%. Similarly, the statistical analysis conducted on geographies consisting of 292,663,090 people shows a poor positive correlation between the proportion of Immigrants from Jamaica and poverty level among children under the age of 5 in the United States with a correlation coefficient (R) of 0.140 and weighted average of 20.5%, a difference of 17.8%.
Child Poverty Under the Age of 5 Correlation Summary
| Measurement | Immigrants from Germany | Immigrants from Jamaica |
| Minimum | 12.7% | 3.1% |
| Maximum | 100.0% | 45.2% |
| Range | 87.3% | 42.1% |
| Mean | 45.8% | 21.0% |
| Median | 27.0% | 20.1% |
| Interquartile 25% (IQ1) | 18.5% | 15.7% |
| Interquartile 75% (IQ3) | 74.9% | 24.8% |
| Interquartile Range (IQR) | 56.4% | 9.1% |
| Standard Deviation (Sample) | 33.9% | 8.1% |
| Standard Deviation (Population) | 33.0% | 8.0% |
Similar Demographics by Child Poverty Under the Age of 5
Demographics Similar to Immigrants from Germany by Child Poverty Under the Age of 5
In terms of child poverty under the age of 5, the demographic groups most similar to Immigrants from Germany are Arab (17.4%, a difference of 0.030%), Hawaiian (17.4%, a difference of 0.050%), South American Indian (17.4%, a difference of 0.050%), Lebanese (17.4%, a difference of 0.070%), and Immigrants from Cameroon (17.4%, a difference of 0.18%).
| Demographics | Rating | Rank | Child Poverty Under the Age of 5 |
| Immigrants | Saudi Arabia | 50.0 /100 | #174 | Average 17.2% |
| Immigrants | Lebanon | 47.6 /100 | #175 | Average 17.3% |
| Immigrants | Iraq | 45.2 /100 | #176 | Average 17.3% |
| Immigrants | Sierra Leone | 43.6 /100 | #177 | Average 17.3% |
| Immigrants | Cameroon | 42.7 /100 | #178 | Average 17.4% |
| Hawaiians | 41.5 /100 | #179 | Average 17.4% |
| South American Indians | 41.4 /100 | #180 | Average 17.4% |
| Immigrants | Germany | 41.0 /100 | #181 | Average 17.4% |
| Arabs | 40.7 /100 | #182 | Average 17.4% |
| Lebanese | 40.3 /100 | #183 | Average 17.4% |
| Immigrants | Costa Rica | 39.0 /100 | #184 | Fair 17.4% |
| Immigrants | Armenia | 38.0 /100 | #185 | Fair 17.5% |
| Immigrants | Bosnia and Herzegovina | 35.0 /100 | #186 | Fair 17.5% |
| Kenyans | 34.7 /100 | #187 | Fair 17.5% |
| Carpatho Rusyns | 33.6 /100 | #188 | Fair 17.5% |
Demographics Similar to Immigrants from Jamaica by Child Poverty Under the Age of 5
In terms of child poverty under the age of 5, the demographic groups most similar to Immigrants from Jamaica are American (20.5%, a difference of 0.12%), Central American (20.6%, a difference of 0.52%), Jamaican (20.4%, a difference of 0.57%), Immigrants from Belize (20.6%, a difference of 0.62%), and Immigrants from Burma/Myanmar (20.4%, a difference of 0.65%).
| Demographics | Rating | Rank | Child Poverty Under the Age of 5 |
| Spanish American Indians | 0.1 /100 | #265 | Tragic 20.2% |
| Aleuts | 0.1 /100 | #266 | Tragic 20.3% |
| Ottawa | 0.1 /100 | #267 | Tragic 20.3% |
| Belizeans | 0.1 /100 | #268 | Tragic 20.3% |
| Immigrants | Burma/Myanmar | 0.1 /100 | #269 | Tragic 20.4% |
| Jamaicans | 0.1 /100 | #270 | Tragic 20.4% |
| Americans | 0.1 /100 | #271 | Tragic 20.5% |
| Immigrants | Jamaica | 0.1 /100 | #272 | Tragic 20.5% |
| Central Americans | 0.1 /100 | #273 | Tragic 20.6% |
| Immigrants | Belize | 0.1 /100 | #274 | Tragic 20.6% |
| Bangladeshis | 0.1 /100 | #275 | Tragic 20.6% |
| West Indians | 0.0 /100 | #276 | Tragic 20.6% |
| Immigrants | West Indies | 0.0 /100 | #277 | Tragic 20.7% |
| Immigrants | Grenada | 0.0 /100 | #278 | Tragic 20.7% |
| Sub-Saharan Africans | 0.0 /100 | #279 | Tragic 20.8% |