Immigrants from France vs Yaqui Child Poverty Under the Age of 16

COMPARE

Immigrants from France
Race
Ancestry
AfghanAfricanAlaska NativeAlaskan AthabascanAlbanianAleutAlsatianAmericanApacheArabArapahoArgentineanArmenianAssyrian/Chaldean/SyriacAustralianAustrianBahamianBangladeshiBarbadianBasqueBelgianBelizeanBermudanBhutaneseBlackfeetBolivianBrazilianBritishBritish West IndianBulgarianBurmeseCajunCambodianCanadianCape VerdeanCarpatho RusynCelticCentral AmericanCentral American IndianCherokeeCheyenneChickasawChileanChineseChippewaChoctawColombianColvilleComancheCosta RicanCreeCreekCroatianCrowCubanCypriotCzechCzechoslovakianDanishDelawareDominicanDutchDutch West IndianEastern EuropeanEcuadorianEgyptianEnglishEstonianEthiopianEuropeanFijianFilipinoFinnishFrenchFrench American IndianFrench CanadianGermanGerman RussianGhanaianGreekGuamanian/ChamorroGuatemalanGuyaneseHaitianHmongHonduranHopiHoumaHungarianIcelanderIndian (Asian)IndonesianInupiatIranianIraqiIrishIroquoisIsraeliItalianJamaicanJapaneseJordanianKenyanKiowaKoreanLaotianLatvianLebaneseLiberianLithuanianLumbeeLuxembourgerMacedonianMalaysianMalteseMarshalleseMenomineeMexicanMexican American IndianMongolianMoroccanNative HawaiianNavajoNepaleseNew ZealanderNicaraguanNigerianNorthern EuropeanNorwegianOkinawanOsageOttawaPaiutePakistaniPalestinianPanamanianParaguayanPennsylvania GermanPeruvianPimaPolishPortuguesePotawatomiPuebloPuerto RicanPuget Sound SalishRomanianRussianSalvadoranSamoanScandinavianScotch-IrishScottishSeminoleSenegaleseSerbianShoshoneSierra LeoneanSiouxSlavicSlovakSloveneSomaliSouth AfricanSouth AmericanSouth American IndianSoviet UnionSpaniardSpanishSpanish AmericanSpanish American IndianSri LankanSubsaharan AfricanSudaneseSwedishSwissSyrianTaiwaneseThaiTlingit-HaidaTohono O'OdhamTonganTrinidadian and TobagonianTsimshianTurkishU.S. Virgin IslanderUgandanUkrainianUruguayanUteVenezuelanVietnameseWelshWest IndianYakamaYugoslavianYumanYup'ikZimbabwean
Immigration
NonimmigrantsImmigrantsAfghanistanAfricaAlbaniaArgentinaArmeniaAsiaAustraliaAustriaBahamasBangladeshBarbadosBelarusBelgiumBelizeBoliviaBosnia and HerzegovinaBrazilBulgariaBurma/MyanmarCabo VerdeCambodiaCameroonCanadaCaribbeanCentral AmericaChileChinaColombiaCongoCosta RicaCroatiaCubaCzechoslovakiaDenmarkDominicaDominican RepublicEastern AfricaEastern AsiaEastern EuropeEcuadorEgyptEl SalvadorEnglandEritreaEthiopiaEuropeFijiFranceGermanyGhanaGreeceGrenadaGuatemalaGuyanaHaitiHondurasHong KongHungaryIndiaIndonesiaIranIraqIrelandIsraelItalyJamaicaJapanJordanKazakhstanKenyaKoreaKuwaitLaosLatin AmericaLatviaLebanonLiberiaLithuaniaMalaysiaMexicoMicronesiaMiddle AfricaMoldovaMoroccoNepalNetherlandsNicaraguaNigeriaNorth AmericaNorth MacedoniaNorthern AfricaNorthern EuropeNorwayOceaniaPakistanPanamaPeruPhilippinesPolandPortugalRomaniaRussiaSaudi ArabiaScotlandSenegalSerbiaSierra LeoneSingaporeSomaliaSouth AfricaSouth AmericaSouth Central AsiaSouth Eastern AsiaSouthern EuropeSpainSri LankaSt. Vincent and the GrenadinesSudanSwedenSwitzerlandSyriaTaiwanThailandTrinidad and TobagoTurkeyUgandaUkraineUruguayUzbekistanVenezuelaVietnamWest IndiesWestern AfricaWestern AsiaWestern EuropeYemenZaireZimbabweAzores
Yaqui
Race
Ancestry
AfghanAfricanAlaska NativeAlaskan AthabascanAlbanianAleutAlsatianAmericanApacheArabArapahoArgentineanArmenianAssyrian/Chaldean/SyriacAustralianAustrianBahamianBangladeshiBarbadianBasqueBelgianBelizeanBermudanBhutaneseBlackfeetBolivianBrazilianBritishBritish West IndianBulgarianBurmeseCajunCambodianCanadianCape VerdeanCarpatho RusynCelticCentral AmericanCentral American IndianCherokeeCheyenneChickasawChileanChineseChippewaChoctawColombianColvilleComancheCosta RicanCreeCreekCroatianCrowCubanCypriotCzechCzechoslovakianDanishDelawareDominicanDutchDutch West IndianEastern EuropeanEcuadorianEgyptianEnglishEstonianEthiopianEuropeanFijianFilipinoFinnishFrenchFrench American IndianFrench CanadianGermanGerman RussianGhanaianGreekGuamanian/ChamorroGuatemalanGuyaneseHaitianHmongHonduranHopiHoumaHungarianIcelanderIndian (Asian)IndonesianInupiatIranianIraqiIrishIroquoisIsraeliItalianJamaicanJapaneseJordanianKenyanKiowaKoreanLaotianLatvianLebaneseLiberianLithuanianLumbeeLuxembourgerMacedonianMalaysianMalteseMarshalleseMenomineeMexicanMexican American IndianMongolianMoroccanNative HawaiianNavajoNepaleseNew ZealanderNicaraguanNigerianNorthern EuropeanNorwegianOkinawanOsageOttawaPaiutePakistaniPalestinianPanamanianParaguayanPennsylvania GermanPeruvianPimaPolishPortuguesePotawatomiPuebloPuerto RicanPuget Sound SalishRomanianRussianSalvadoranSamoanScandinavianScotch-IrishScottishSeminoleSenegaleseSerbianShoshoneSierra LeoneanSiouxSlavicSlovakSloveneSomaliSouth AfricanSouth AmericanSouth American IndianSoviet UnionSpaniardSpanishSpanish AmericanSpanish American IndianSri LankanSubsaharan AfricanSudaneseSwedishSwissSyrianTaiwaneseThaiTlingit-HaidaTohono O'OdhamTonganTrinidadian and TobagonianTsimshianTurkishU.S. Virgin IslanderUgandanUkrainianUruguayanUteVenezuelanVietnameseWelshWest IndianYakamaYaquiYugoslavianYumanYup'ikZimbabwean
Immigration
NonimmigrantsImmigrantsAfghanistanAfricaAlbaniaArgentinaArmeniaAsiaAustraliaAustriaBahamasBangladeshBarbadosBelarusBelgiumBelizeBoliviaBosnia and HerzegovinaBrazilBulgariaBurma/MyanmarCabo VerdeCambodiaCameroonCanadaCaribbeanCentral AmericaChileChinaColombiaCongoCosta RicaCroatiaCubaCzechoslovakiaDenmarkDominicaDominican RepublicEastern AfricaEastern AsiaEastern EuropeEcuadorEgyptEl SalvadorEnglandEritreaEthiopiaEuropeFijiGermanyGhanaGreeceGrenadaGuatemalaGuyanaHaitiHondurasHong KongHungaryIndiaIndonesiaIranIraqIrelandIsraelItalyJamaicaJapanJordanKazakhstanKenyaKoreaKuwaitLaosLatin AmericaLatviaLebanonLiberiaLithuaniaMalaysiaMexicoMicronesiaMiddle AfricaMoldovaMoroccoNepalNetherlandsNicaraguaNigeriaNorth AmericaNorth MacedoniaNorthern AfricaNorthern EuropeNorwayOceaniaPakistanPanamaPeruPhilippinesPolandPortugalRomaniaRussiaSaudi ArabiaScotlandSenegalSerbiaSierra LeoneSingaporeSomaliaSouth AfricaSouth AmericaSouth Central AsiaSouth Eastern AsiaSouthern EuropeSpainSri LankaSt. Vincent and the GrenadinesSudanSwedenSwitzerlandSyriaTaiwanThailandTrinidad and TobagoTurkeyUgandaUkraineUruguayUzbekistanVenezuelaVietnamWest IndiesWestern AfricaWestern AsiaWestern EuropeYemenZaireZimbabweAzores
Child Poverty Under the Age of 16
Income
Poverty
Unemployment
Labor Participation
Family Structure
Vehicle Availability
Education Level
Disability

Child Poverty Under the Age of 16 Comparison

Immigrants from France

Yaqui

Exceptional
Tragic
14.7%
CHILD POVERTY UNDER THE AGE OF 16
95.8/ 100
METRIC RATING
96th/ 347
METRIC RANK
20.4%
CHILD POVERTY UNDER THE AGE OF 16
0.0/ 100
METRIC RATING
290th/ 347
METRIC RANK

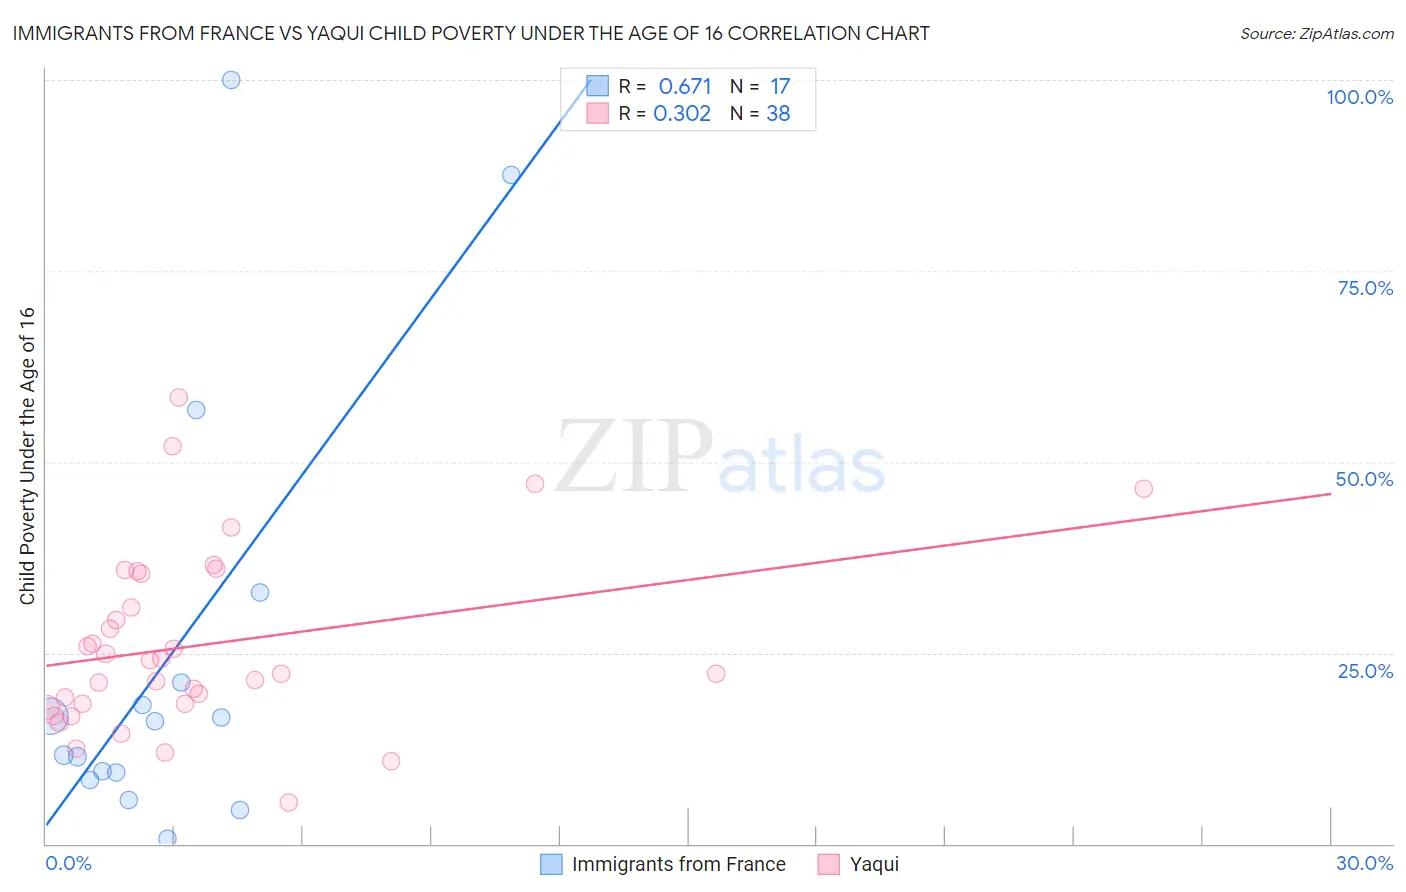
Immigrants from France vs Yaqui Child Poverty Under the Age of 16 Correlation Chart

The statistical analysis conducted on geographies consisting of 285,695,647 people shows a significant positive correlation between the proportion of Immigrants from France and poverty level among children under the age of 16 in the United States with a correlation coefficient (R) of 0.671 and weighted average of 14.7%. Similarly, the statistical analysis conducted on geographies consisting of 107,580,409 people shows a mild positive correlation between the proportion of Yaqui and poverty level among children under the age of 16 in the United States with a correlation coefficient (R) of 0.302 and weighted average of 20.4%, a difference of 38.7%.
Immigrants from France vs Yaqui Child Poverty Under the Age of 16

Child Poverty Under the Age of 16 Correlation Summary

MeasurementImmigrants from FranceYaqui
Minimum0.60%5.4%
Maximum100.0%58.4%
Range99.4%53.0%
Mean25.1%26.0%
Median16.0%23.1%
Interquartile 25% (IQ1)8.9%18.3%
Interquartile 75% (IQ3)27.0%35.3%
Interquartile Range (IQR)18.1%17.0%
Standard Deviation (Sample)28.9%11.9%
Standard Deviation (Population)28.1%11.7%

Similar Demographics by Child Poverty Under the Age of 16

Demographics Similar to Immigrants from France by Child Poverty Under the Age of 16

In terms of child poverty under the age of 16, the demographic groups most similar to Immigrants from France are Paraguayan (14.7%, a difference of 0.12%), Immigrants from Belarus (14.7%, a difference of 0.13%), Immigrants from Croatia (14.6%, a difference of 0.25%), British (14.7%, a difference of 0.25%), and Immigrants from South Africa (14.6%, a difference of 0.41%).
DemographicsRating | RankChild Poverty Under the Age of 16
Germans
96.9
/100
|
#89
Exceptional
14.5%
Austrians
96.9
/100
|
#90
Exceptional
14.5%
Immigrants | North America
96.7
/100
|
#91
Exceptional
14.6%
Immigrants | Italy
96.7
/100
|
#92
Exceptional
14.6%
Argentineans
96.6
/100
|
#93
Exceptional
14.6%
Immigrants | South Africa
96.3
/100
|
#94
Exceptional
14.6%
Immigrants | Croatia
96.1
/100
|
#95
Exceptional
14.6%
Immigrants | France
95.8
/100
|
#96
Exceptional
14.7%
Paraguayans
95.7
/100
|
#97
Exceptional
14.7%
Immigrants | Belarus
95.7
/100
|
#98
Exceptional
14.7%
British
95.5
/100
|
#99
Exceptional
14.7%
Dutch
95.1
/100
|
#100
Exceptional
14.8%
Immigrants | Switzerland
95.1
/100
|
#101
Exceptional
14.8%
Romanians
95.0
/100
|
#102
Exceptional
14.8%
Immigrants | Egypt
94.9
/100
|
#103
Exceptional
14.8%

Demographics Similar to Yaqui by Child Poverty Under the Age of 16

In terms of child poverty under the age of 16, the demographic groups most similar to Yaqui are Senegalese (20.4%, a difference of 0.040%), Immigrants from Belize (20.3%, a difference of 0.28%), Chippewa (20.5%, a difference of 0.75%), Immigrants from Latin America (20.5%, a difference of 0.79%), and Blackfeet (20.2%, a difference of 0.87%).
DemographicsRating | RankChild Poverty Under the Age of 16
Immigrants | Zaire
0.0
/100
|
#283
Tragic
20.1%
West Indians
0.0
/100
|
#284
Tragic
20.1%
Immigrants | St. Vincent and the Grenadines
0.0
/100
|
#285
Tragic
20.1%
Immigrants | West Indies
0.0
/100
|
#286
Tragic
20.2%
Blackfeet
0.0
/100
|
#287
Tragic
20.2%
Immigrants | Belize
0.0
/100
|
#288
Tragic
20.3%
Senegalese
0.0
/100
|
#289
Tragic
20.4%
Yaqui
0.0
/100
|
#290
Tragic
20.4%
Chippewa
0.0
/100
|
#291
Tragic
20.5%
Immigrants | Latin America
0.0
/100
|
#292
Tragic
20.5%
Immigrants | Senegal
0.0
/100
|
#293
Tragic
20.6%
Haitians
0.0
/100
|
#294
Tragic
20.7%
Mexicans
0.0
/100
|
#295
Tragic
20.7%
Immigrants | Caribbean
0.0
/100
|
#296
Tragic
20.8%
Hispanics or Latinos
0.0
/100
|
#297
Tragic
20.8%